


1. Introduction
The identification of objects is a fundamental aspect of visual perception and has wide-ranging practical applications, such as in the field of autonomous vehicles, surveillance, robotics, and image retrieval. Improving the accuracy of object detection algorithms can lead to significant advancements in these applications and contribute to the development of more intelligent and efficient systems.
In recent years, tremendous strides have been made in the field of object detection. In the past, manual features and basic learning techniques were primarily used, but have since been supplanted by more sophisticated approaches such as Convolutional Neural Networks (CNNs) [1]. Recent object detection algorithms, such as R-CNN [1], and Faster R-CNN [1], have exhibited exceptional results in a wide range of object detection tasks. Despite their complexity, these techniques may not be suitable for immediate use due to their resource-intensive nature.
This research suggests YOLO (You Only Look Once) [2] as a viable algorithm for object detection, as it has proven to be both accurate and efficient. The YOLO algorithm achieved an overall accuracy of 53.2% on the VOC 2007 dataset [3], with an average precision (AP) of 48% and a mean average precision (mAP) of 47.3% at an IoU threshold of 0.5 [4].
This paper is structured as follows: We begin with a description of the YOLO algorithm, including its model architecture and parameter tuning. Next, we present our experimental setup, detailing the dataset, pre-processing techniques, and evaluation metrics. We then report the results of our experiments, followed by a discussion of the algorithm's performance and potential improvements. We end by summarizing our discoveries and outlining potential areas for future study.
2. Method
2.1. Data description
The dataset has a variety of images with different dimensions and proportions, totalling 9963. This dataset encompasses 20 distinct types of objects, including transportation, animals, people and household items. The dataset is divided into three sections: 5011 images in the training set and 4952 images in the test set. The training and validation data are utilized for teaching the model and tweaking the hyperparameters, whereas the test set is applied to evaluate the model's efficacy. Every photograph is marked with boundaries of the objects present and their respective categories.
2.2. Data pre-processing
To prepare the data for the YOLOv5 algorithm, several preprocessing steps are performed. These steps include normalization, resizing, and class balancing using weighted sampling.
1.1.1. Normalization. To improve the performance and convergence of the YOLOv5 model, normalization is applied to the input images [5]. This step involves scaling the pixel values of the images from their original range (0-255) to a range of (0-1). Normalization helps the model to learn more efficiently by ensuring that the input features are on the same scale [5].
1.1.2. Resizing. The input images in the VOC2007 dataset have varying sizes. However, the YOLOv5 model requires a fixed input size for efficient processing [2]. Therefore, the images are resized to a consistent size, typically 416x416 or 640x640 pixels, before being fed into the model. Resizing ensures that the model can process images of different dimensions while maintaining a uniform input size.
2.2.3. Class balancing (weighted sampling). In the VOC2007 dataset, some object classes are more frequent than others, which may lead to a biased model that performs poorly on less frequent classes. To address this issue, class balancing using weighted sampling is implemented during training. Weighted sampling assigns a higher sampling probability to under-represented classes, allowing the model to see more examples of these classes during training. This approach helps to balance the distribution of the classes and ensures that the model learns to detect all object categories equally well [6].
1.2. YOLOv5
1.2.1. YOLO description. The YOLO (You Only Look Once) algorithm has become well-known for its superior accuracy and rapidity, making it an attractive choice for real-time object detection [2]. We employ YOLOv5 in our setup, taking advantage of its advancements on previous YOLO models and thus boosting its efficacy.
1.2.2. YOLO model architecture. The YOLOv5 model architecture consists of multiple layers designed for efficient object detection. In our implementation, we adjust the model to work with 20 object categories from the VOC2007 dataset. The architecture can be divided into three main components: the backbone, the neck, and the head.
• Backbone: In YOLOv5, the backbone is based on CSPNet [7] and is responsible for efficient feature extraction. We use the optimal depth and width multipliers of 0.33 and 0.2, respectively, to balance model complexity and computational efficiency.
• Neck: YOLOv5 uses PANet (Path Aggregation Network) [8] in its neck, enabling it to merge multi-scale features and enhance its capacity to identify objects of various sizes.
• Head: In YOLOv5, the head has separate output layers for detecting objects at different scales. We modify the default number of classes in the head from 80 to 20 to match the VOC2007 dataset .
1.2.3. YOLO parameter tuning. The process of parameter tuning for the YOLO algorithm involves adjusting various hyperparameters to optimize model performance. In our implementation, we use the following hyperparameter values:
• Learning rate: 0.001, which allows for a balance between the convergence speed and the risk of overshooting the optimal solution.
• Batch size: 16, which is a compromise between the memory requirements and the stability of gradient estimates.
• Epochs: 10, which was determined to be an appropriate number of passes through the entire training dataset, balancing the risk of overfitting and underfitting.
• Weight decay: 0.0005, which including a penalty term to the loss function that promotes smaller model weights, the weight decay is utilized to combat overfitting.
We employed strategies like grid search and random search [9] to find the optimal hyperparameter combination for the VOC2007 dataset and object detection task.
1.3. Evaluation metrics
1.3.1. Accuracy. The accuracy of YOLO can be gauged by comparing the predicted labels and boundaries of objects to the known labels and boundaries in the testing dataset. The accuracy can be determined by dividing the amount of correct predictions (a1 and a2) by the total predictions made (A), as in equation (1).
\( Accuracy(A)=\frac{a1+a2}{A} \) (1)
1.3.2. Precision. The Precision of the predicted objects can be determined by the proportion of them that are correctly identified. One way to calculate the outcome is by dividing the number of correctly identified positives (TP) by the sum of correctly identified positives and falsely identified positives (FP), as in equation (2).
\( Precison= \frac{TP}{TP+FP} \) (2)
1.3.3. True Positive Rate (TPR). The YOLO algorithm's accuracy is assessed by TPR, which is the proportion of actual positive objects that are accurately identified. The calculation is done by dividing the amount of correct identifications (TP) by the total of correct identifications and incorrect rejections (FN), as in equation (3).
\( True Positive Rate(TPR)=\frac{TP}{TP+FN} \) (3)
1.3.4. Confusion Matrix. The confusion matrix is a type of chart that outlines the number of accurate positives (TP), accurate negatives (TN), erroneous positives (FP), and erroneous negatives (FN) for each category. This matrix offers an understanding of the model's capacity to differentiate between multiple object classes and accurately identify objects.
2. Results
2.1. Model performance
After training the YOLOv5 model using the VOC2007 dataset, the results were obtained as shown in Fig 1.
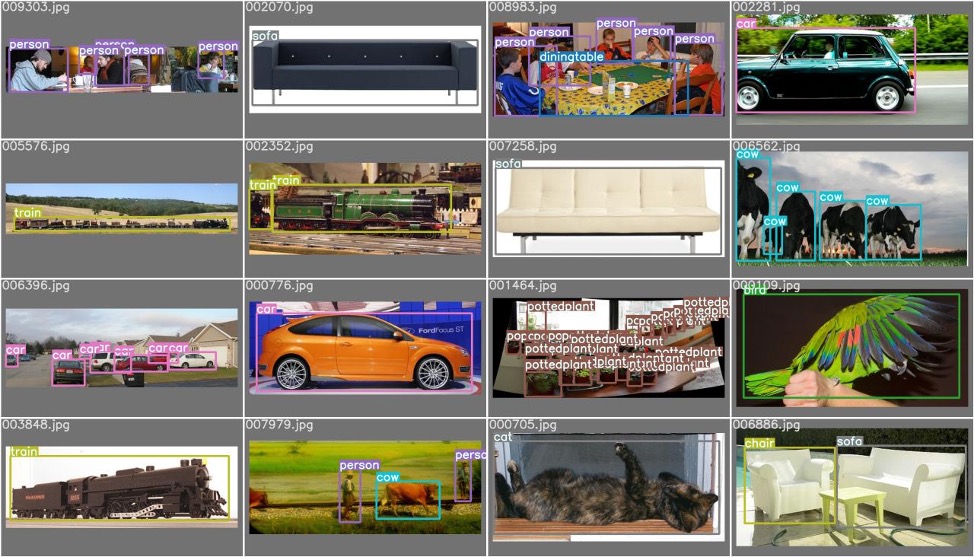
Figure 1. Example of result.
2.1.1. Overall performance. The model achieved an overall accuracy of 53.2% on the test set, with an average precision (AP) of 48% and a mean average precision (mAP) of 47.3% at IoU threshold of 0.5 as shown in Fig 2.. The data from the VOC2007 dataset shows that the model can be further improved in its ability to recognize objects from various categories.
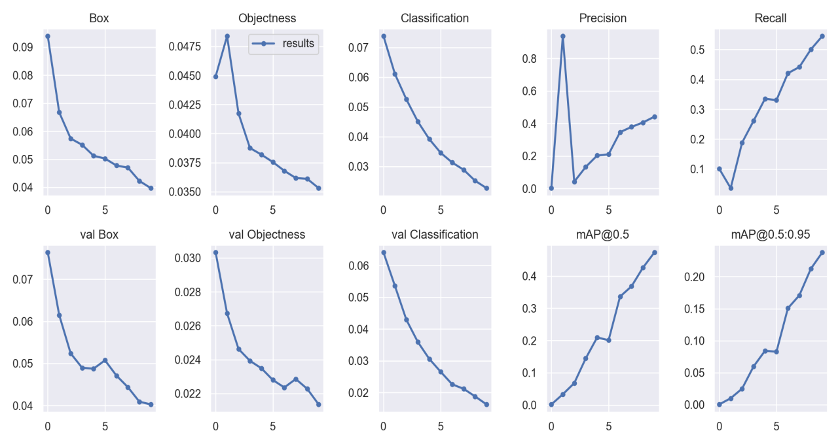
Figure 2. mAP@0.5.
2.1.2. Category-wise performance. The model's performance varied across different object categories. The highest precision was achieved for the "person" category at 80%, followed by the "car" category at 78.1%. The lowest precision was observed for the "dining table" and "sofa" categories at 14.1% and 11.2%, respectively
2.2. Confusion Matrix analysis
The results of the confusion matrix as shown in Fig 3. suggested that the model was quite successful in distinguishing between "person" and "car" categories, likely because the training set contained a larger quantity of samples for these classes as shown in Fig 4.. However, the model struggled with detecting "dining table" and "sofa" categories, which had relatively lower detection accuracy and were often mistaken as background.
Moreover, the model misclassified some "bus" instances as "car" or "train" due to their similarities, suggesting that the model has difficulties in distinguishing between closely related categories.
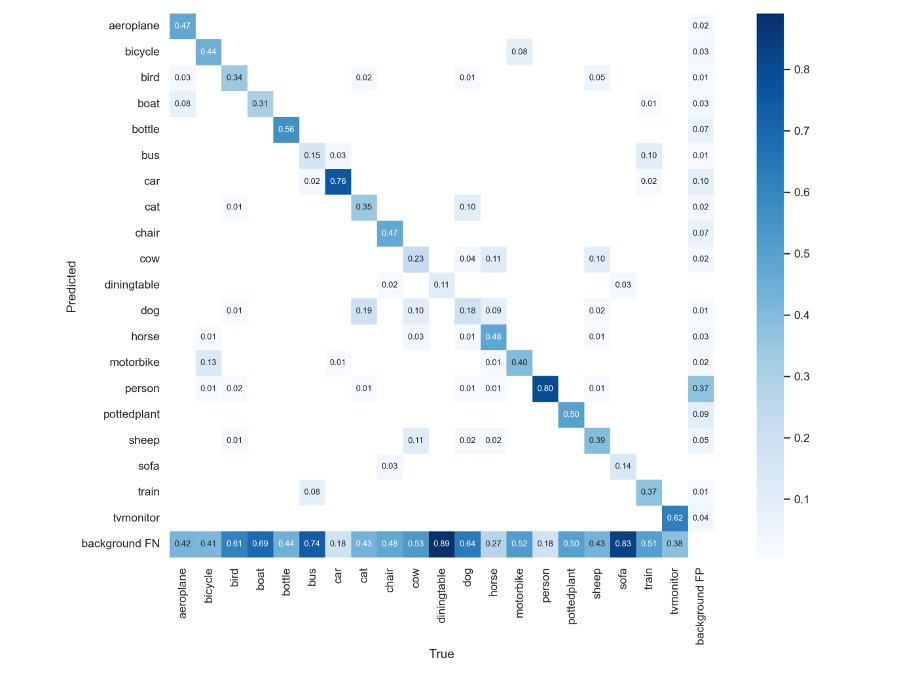
Figure 3. Confusion matrix of results.
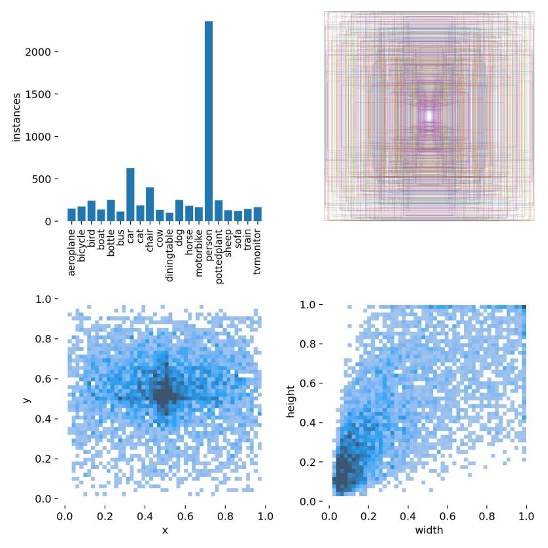
Figure 4. Label frequency and parameter graph.
2.3. Precision curve
The precision curve as shown in Fig 5. showed that "person" and "car" categories had better performance than the average level, whereas "dining table" and "sofa" categories were below the average line. The "bus" category exhibited a noticeable drop between 0.4-0.5 confidence levels, followed by an upswing at higher confidence levels.
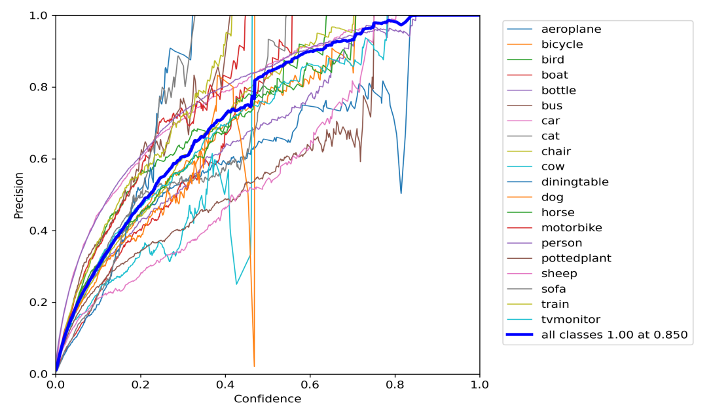
Figure 5. Persian curve of results.
This pattern suggests that the classifier is making mistakes when predicting the positive class at intermediate confidence levels but is able to recover and achieve high precision at higher confidence levels. It also indicates that the classifier struggles to distinguish between positive and negative examples that are very similar in appearance, such as "car" and "bus".
In conclusion, the YOLOv5 model achieved a moderate overall accuracy and precision in detecting objects in the VOC2007 dataset. However, the performance varied across different categories, with lower accuracy observed for less frequent categories such as "dining table" and "sofa". Additionally, the model had difficulties in distinguishing between closely related categories like "car" and "bus". Further improvements can be made by incorporating additional training data for underrepresented categories and refining the model to better distinguish between similar objects [4].
3. Discussion
YOLO algorithm achieved moderate performance on the VOC 2007 dataset. A mAP of 47.3% indicates that the algorithm was able to accurately detect and classify objects in some images but struggled in others. A variety of elements, such as the object classes spread throughout the dataset, the annotations' accuracy, and the hyperparameters utilized for teaching the model, may have had an effect on the algorithm's execution.
The imbalance in the number of classes of objects in the dataset could be the cause of the algorithm's poor performance. Some object classes, such as "person" and "car", were over-represented in the dataset, while others, such as "bottle" and "cow", were under-represented. This imbalance can make it difficult for the algorithm to learn to detect and classify objects from the under-represented classes, leading to lower performance [10].
To address this issue, class balancing techniques such as weighted sampling can be used to assign higher weights to the examples from the under-represented classes during training [10]. This can enhance the algorithm's proficiency in dealing with the classes that are underserved, and guarantee that the algorithm is capable of managing items from a broad assortment of classes.
One alternative method for boosting the algorithm's efficiency for minority classes is to increase the amount of data. This requires creating novel samples from the pre-existing ones through arbitrary alterations like trimming, flipping, and turning [11]. Augmenting data can assist in enlarging the data set and making the model more robust, thus simplifying the process of the algorithm recognizing objects that are not often seen.
In summary, the YOLO method demonstrates considerable promise in the realm of object detection and categorization tasks. Nonetheless, additional investigation is required to enhance its efficacy on object classes that are less represented. With the use of class balancing techniques and data augmentation, it may be possible to train the algorithm to detect and classify objects from a wider range of classes with higher accuracy.
4. Conclusion
This research has investigated the application of YOLOv5 for identifying objects in the VOC2007 dataset. The model achieved a moderate overall accuracy and precision, indicating its potential for object detection tasks. However, the performance varied across different categories, with lower accuracy observed for less frequent categories such as "dining table" and "sofa". Additionally, the model had difficulties in distinguishing between closely related categories like "car" and "bus".
We have pinpointed various strategies to help enhance the YOLOv5 model's performance on this dataset, like employing weighted sampling to balance classes and data augmentation. These techniques may help the model to better learn to detect objects from under-represented categories and improve its ability to distinguish between similar objects.
To sum up, the YOLO algorithm has the potential to be effective in detecting and labelling objects in computer vision projects. Further research and improvements can be made to increase its performance on a wider range of object classes, leading to advancements in fields such as autonomous vehicles, surveillance, robotics, and image retrieval. Subsequent research may investigate the combination of the YOLO algorithm with other leading-edge approaches to augment its effectiveness and usability in practical settings.