


1. Introduction
Diabetes has been a long-lasting health issue among many people, especially diabetes has become the most predominant phenomenon among women. Recent studies have shown that diabetes prevalence has been on the rise, with significant health and economic impacts worldwide [1]. In particular, the prevalence of diabetes has been notably increasing in several countries, with global estimates suggesting that the prevalence of diabetes for all age-groups worldwide was estimated to be 2.8% in 2000 and is projected to rise to 4.4% in 2030 [2]. Another study indicated that the global burden of diabetes had significantly increased since 1990, with an incidence of 22.9 million and a prevalence of 476.0 million in 2017 [3]. Furthermore, specific regions such as Southeast Asia have seen a rapid increase in diabetes cases [4]. In Indonesia, urban childhood residence and high education have been identified as risk factors for early-onset adult diabetes [5]. Moreover, there’s a significant prevalence of diabetes among patients with pulmonary tuberculosis, emphasizing the comorbidity of these conditions in global health scenarios [6]. Recent data from the US also highlighted that the age-standardized prevalence of diabetes increased significantly from 9.8% in 1999-2000 to 14.3% in 2017-2018 [7]. The factors involved in the development of lung cancer were very complex, and its occurrence was the result of multi-factorial, multi-gene, and multi-step interactions [5]. Domestic and foreign scholars had found some correlation between lung cancer and smoking [6], passive smoking [7], and sleep duration [8, 9]. In addition, Sun found that other factors also had some impact on lung cancer [10]. However, this literature studied fewer lung cancer factors and lacked systematic and complete statistics. Therefore, this paper focuses on 15 factors (Gender, Age, Smoking, Yellow fingers, Anxiety, Peer-pressure, Chronic Disease, Fatigue, Allergy, Wheezing, Alcohol, Coughing, Shortness of Breath, Swallowing Difficulty, and Chest pain) to study whether they have any effect on lung cancer, and further select an appropriate model to study the degree of correlation between these factors and lung cancer.
After returned the manuscript must be appropriately modified. Hence, it’s crucial to delve deeper into the factors associated with diabetes to facilitate early detection, treatment, and prevention, thereby reducing associated morbidities and mortalities. This paper aims to explore various potential factors that could lead to diabetes, assisting individuals in assessing their risk and adopting preventive measures accordingly for females.
The factors contributing to diabetes are multifaceted, encompassing genetic, environmental, and lifestyle elements [8]. Numerous studies have highlighted associations between diabetes and factors such as obesity [9], sedentary lifestyle [10], and dietary habits. Nevertheless, much of the existing literature has focused on a limited set of factors, often lacking comprehensive statistical analysis on a particular group: Women. Thus, this study will concentrate on the parameters provided in the dataset, namely Pregnancies, Glucose, Blood Pressure, Skin Thickness, Insulin, BMI, DiabetesPedigreeFunction, and Age, to ascertain their potential influence on diabetes.
In line with this research focus, various scholars have adopted different analytical models. For instance, they have been using Decision Trees, Random Forest, and Naive Bayes to perform forecasts and analysis on existing dataset on diabetes. However, it would only be performing logistic regression on the existing data set to help females to prevent and improve diabetes in advance.
2. Methods
2.1. Data Sources
The data for this literature is collected from the Kaggle website, which was compiled by AKSHAY DATTATRAY KHARE. This dataset is originally from the National Institute of Diabetes and Digestive and Kidney Diseases and updated in 2022 for 769 individuals.
2.2. Variable Selection
The data used in this analysis counts a total of 768 people, including those who have and do not have diabetes. The patients’ ages range from 21 to 81 years. The data contains 8 variables: Pregnancies, Glucose, Blood Pressure, Skin Thickness, Insulin, BMI, Diabetes Pedigree Function, and Age.
Note that for this table 1, “Number1” represents the total number of people in the dataset (which is 768 for all variables). “Diabetes1” represents the number of people with diabetes who have non-zero values for the respective variable.
Table 1. This caption has one line so it is centered.
Elements | Logogram | Number1 | Diabetes1 |
Pregnancies | x1 | 768 | 230 |
Glucose | x2 | 768 | 266 |
Blood Pressure | x3 | 768 | 252 |
Skin Thickness | x4 | 768 | 180 |
Insulin | x5 | 768 | 130 |
BMI | x6 | 768 | 266 |
Diabetes Pedigree Function | x7 | 768 | 268 |
Age | x8 | 768 | 268 |
Table 2. Age distribution and diabetes prevalence by age group.
Age | Number 2 | Diabetes2 |
[21-30] | 396 | 84 |
[31-40] | 165 | 76 |
[41-50] | 118 | 65 |
[51-60] | 57 | 34 |
[61-70] | 29 | 8 |
[71-80] | 2 | 1 |
[81-90] | 1 | 0 |
Note that “Number 2” represents the number of people in each age group. “Diabetes 2” represents the number of people in each age group who have diabetes. The majority of people in the dataset are aged between 21-30 and 31-40 years old (Table 2).
3. Results and Discussion
The majority of the individuals in the dataset are between the ages of 20 and 40, meaning there are fewer older individuals compared to younger ones (Figure 1). The dataset primarily captures data from relatively younger individuals. This might be a reflection of the sample population from which the data was collected. A right-skewed age distribution suggests that diabetes screening or the particular study from which this data originates may have had a higher representation of younger adults. It’s essential to be aware of this distribution, especially when considering factors like age-related risk. Younger individuals might have different risk profiles compared to older individuals.
Glucose, BMI, Age, and Pregnancies show the most substantial positive correlations with the Outcome (presence of diabetes). Features like BloodPressure and SkinThickness have weaker correlations with the outcome. Correlation coefficients provide a measure of the linear relationship between two variables. A value closer to 1 indicates a strong positive relationship, while a value closer to -1 indicates a strong negative relationship. The significant positive correlation of Glucose with the outcome reinforces the medical understanding that elevated blood glucose levels are a key indicator of diabetes. While BMI and Age also have positive correlations with the outcome, it’s crucial to note that correlation doesn’t imply causation. Higher BMI might be a risk factor for diabetes, but it’s one of many potential factors. Weaker correlations for features like BloodPressure suggest that, while they might play a role in the overall health profile, they might not be as directly indicative of diabetes as Glucose or BMI (Figure 2).
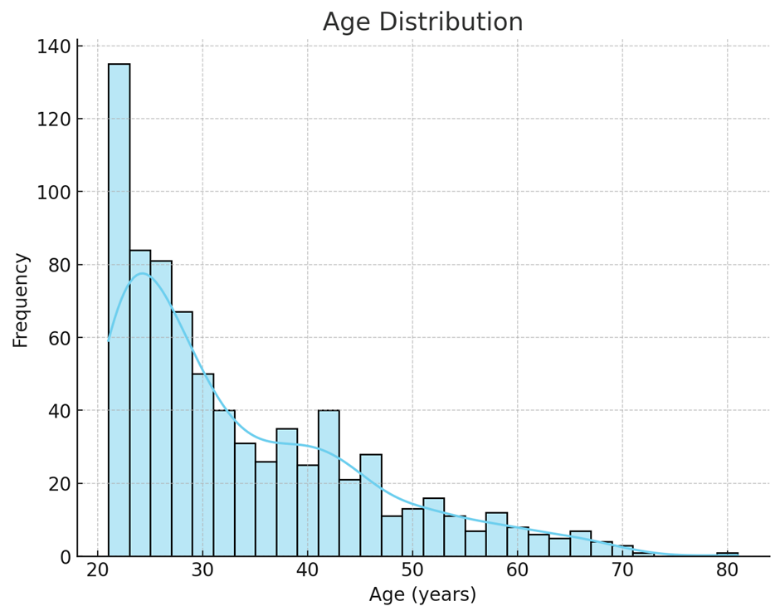
Figure 1. Age Distribution (Histogram).
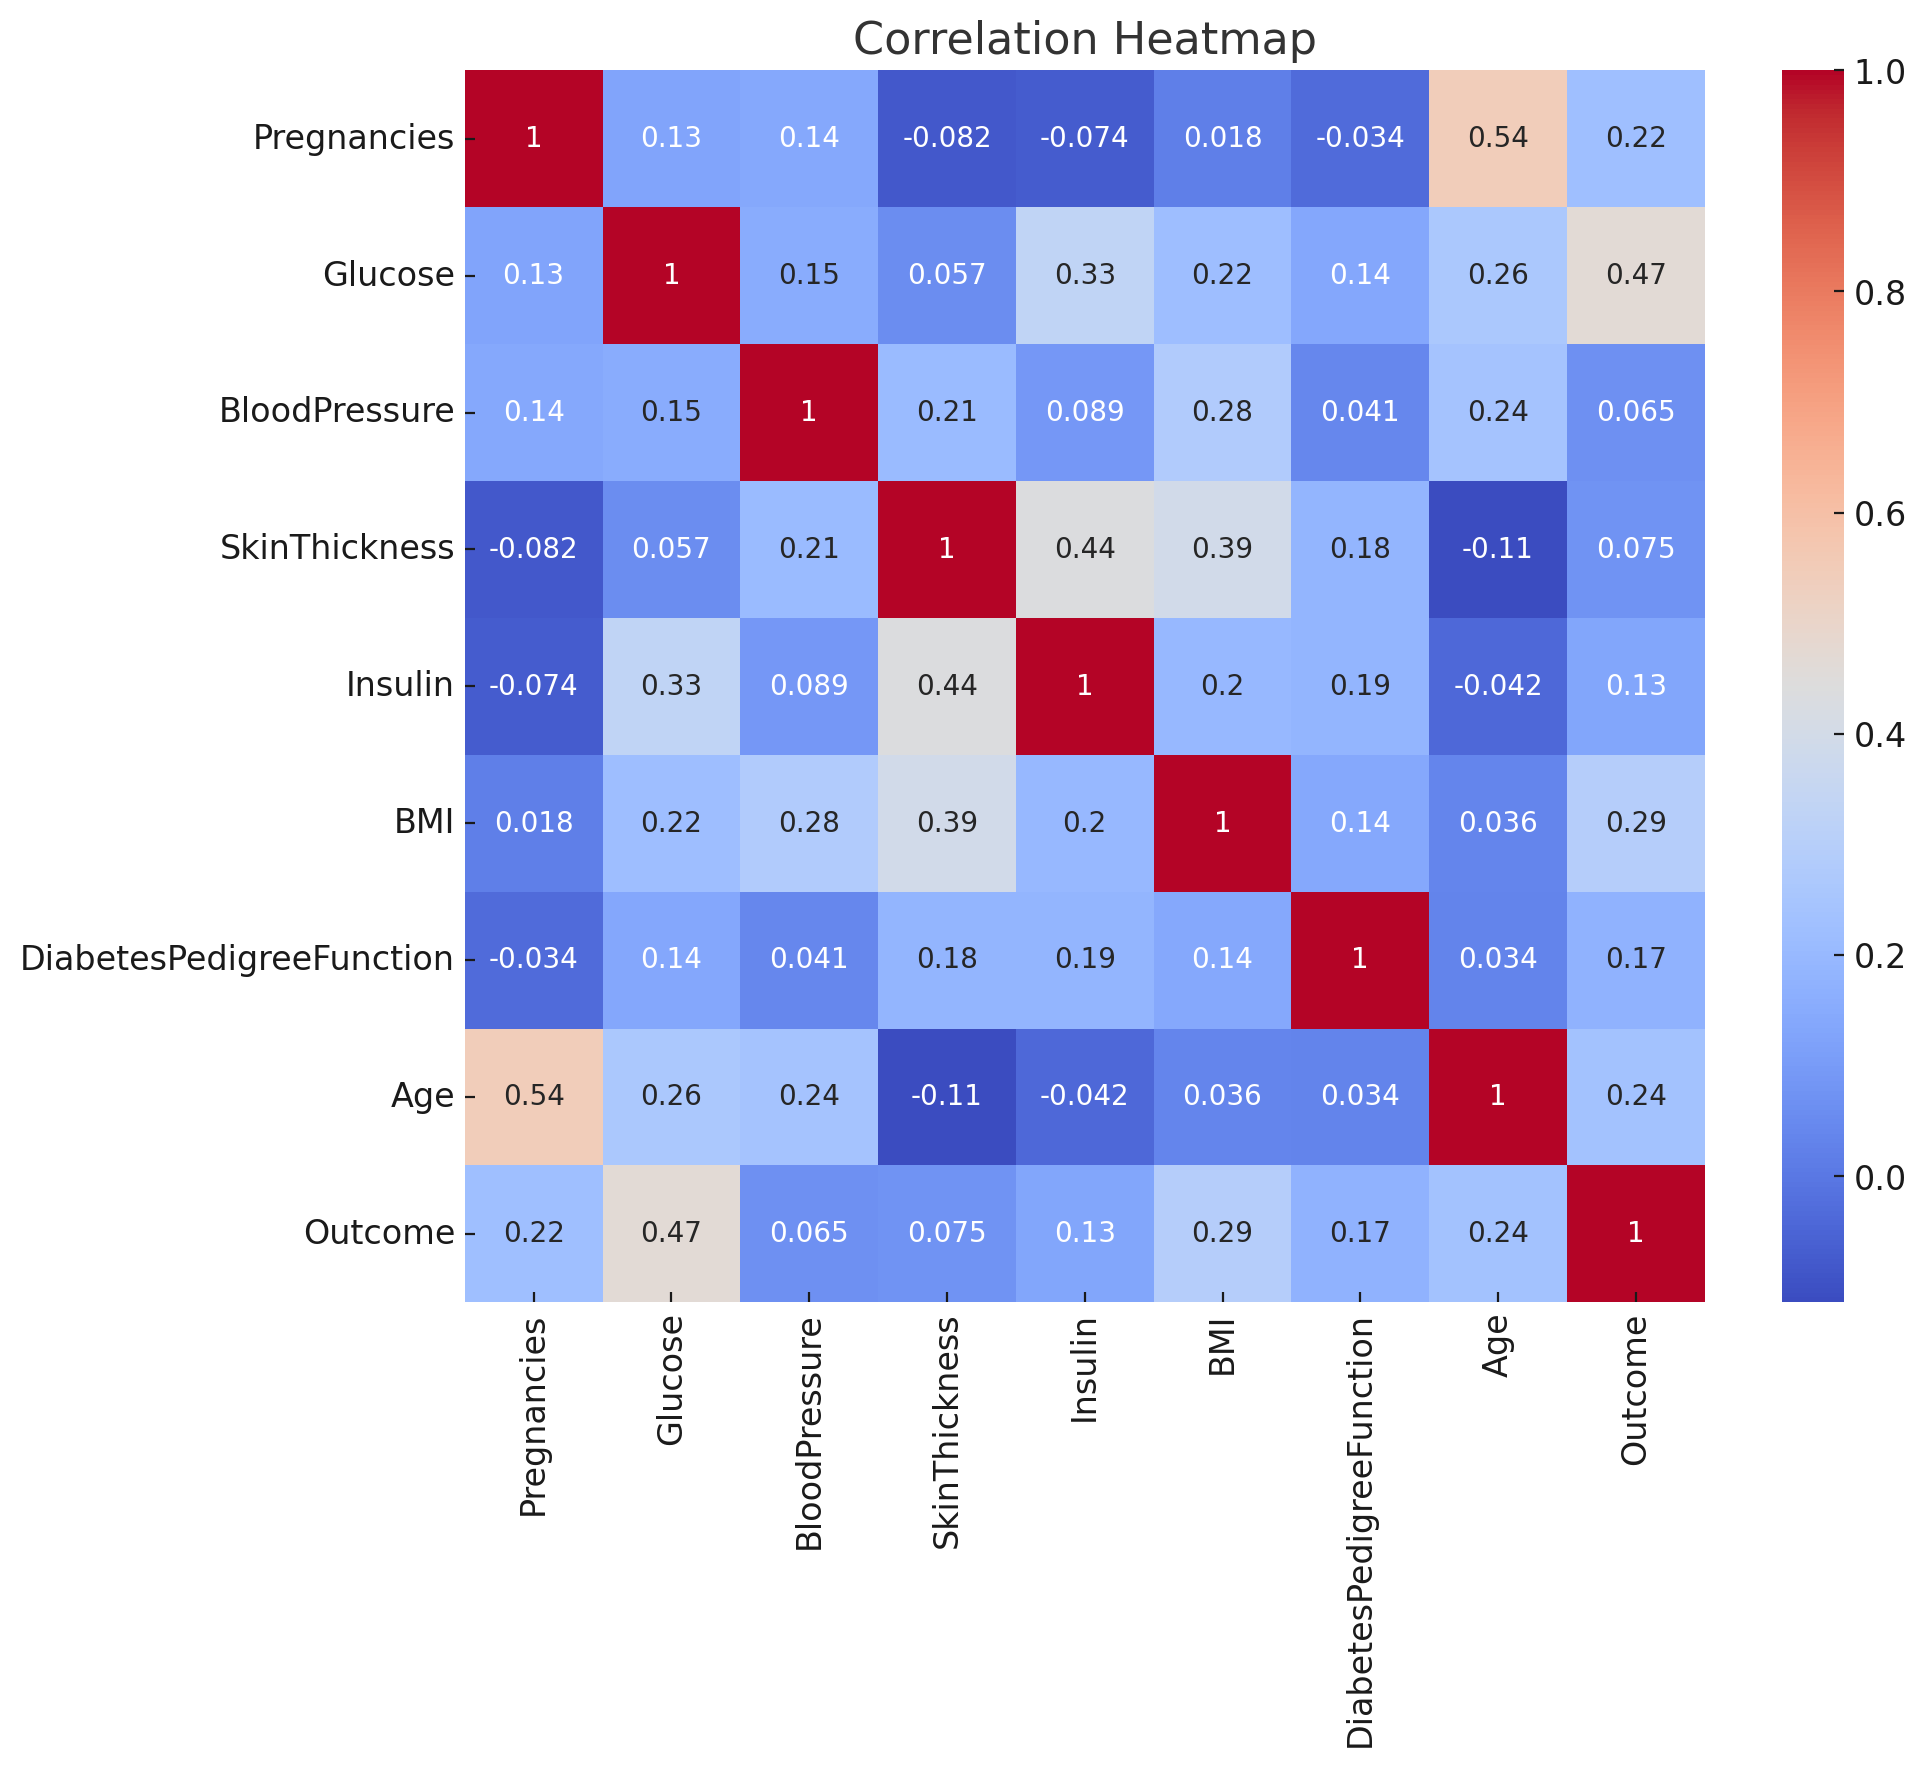
Figure 2. Correlation Heatmap.
Individuals with diabetes generally have higher glucose levels than those without. There’s a clear distinction in the median glucose levels between the two groups. Elevated glucose levels are a hallmark of diabetes. The body’s inability to regulate glucose (either due to insufficient insulin production or insulin resistance) leads to higher blood glucose concentrations. The boxplot visually reinforces this understanding, showing that even the lower quartile of glucose levels for diabetic individuals is higher than the median for non-diabetic individuals. However, there’s some overlap, indicating that while glucose is a strong indicator, it’s not the sole determinant. Some individuals might have higher glucose levels due to reasons other than diabetes (Figure 3).
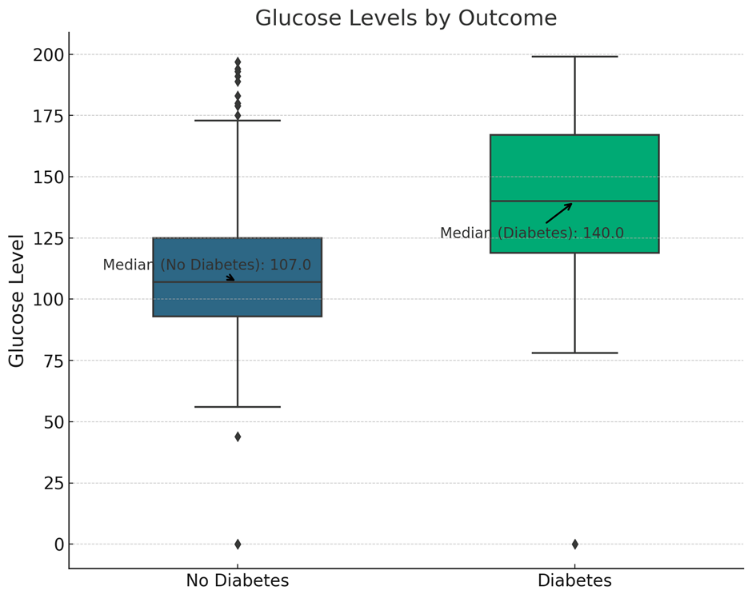
Figure 3. Glucose Levels by Outcome (Boxplot).
A general trend suggests that individuals with higher BMI values and higher glucose levels are more likely to have diabetes. However, there’s a spread, indicating variability. Both elevated glucose levels and higher BMI values are recognized risk factors for diabetes. This plot visualizes their combined potential impact. While there’s a general trend, the scatter and overlap between the two groups (diabetic and non-diabetic) suggest that these two factors, while influential, aren’t absolute determinants. Other factors, both measured and unmeasured, play a role in the disease’s onset. BMI, while a useful metric, is a broad indicator and doesn’t account for factors like muscle mass vs. fat distribution, which can influence diabetes risk (Figure 4).
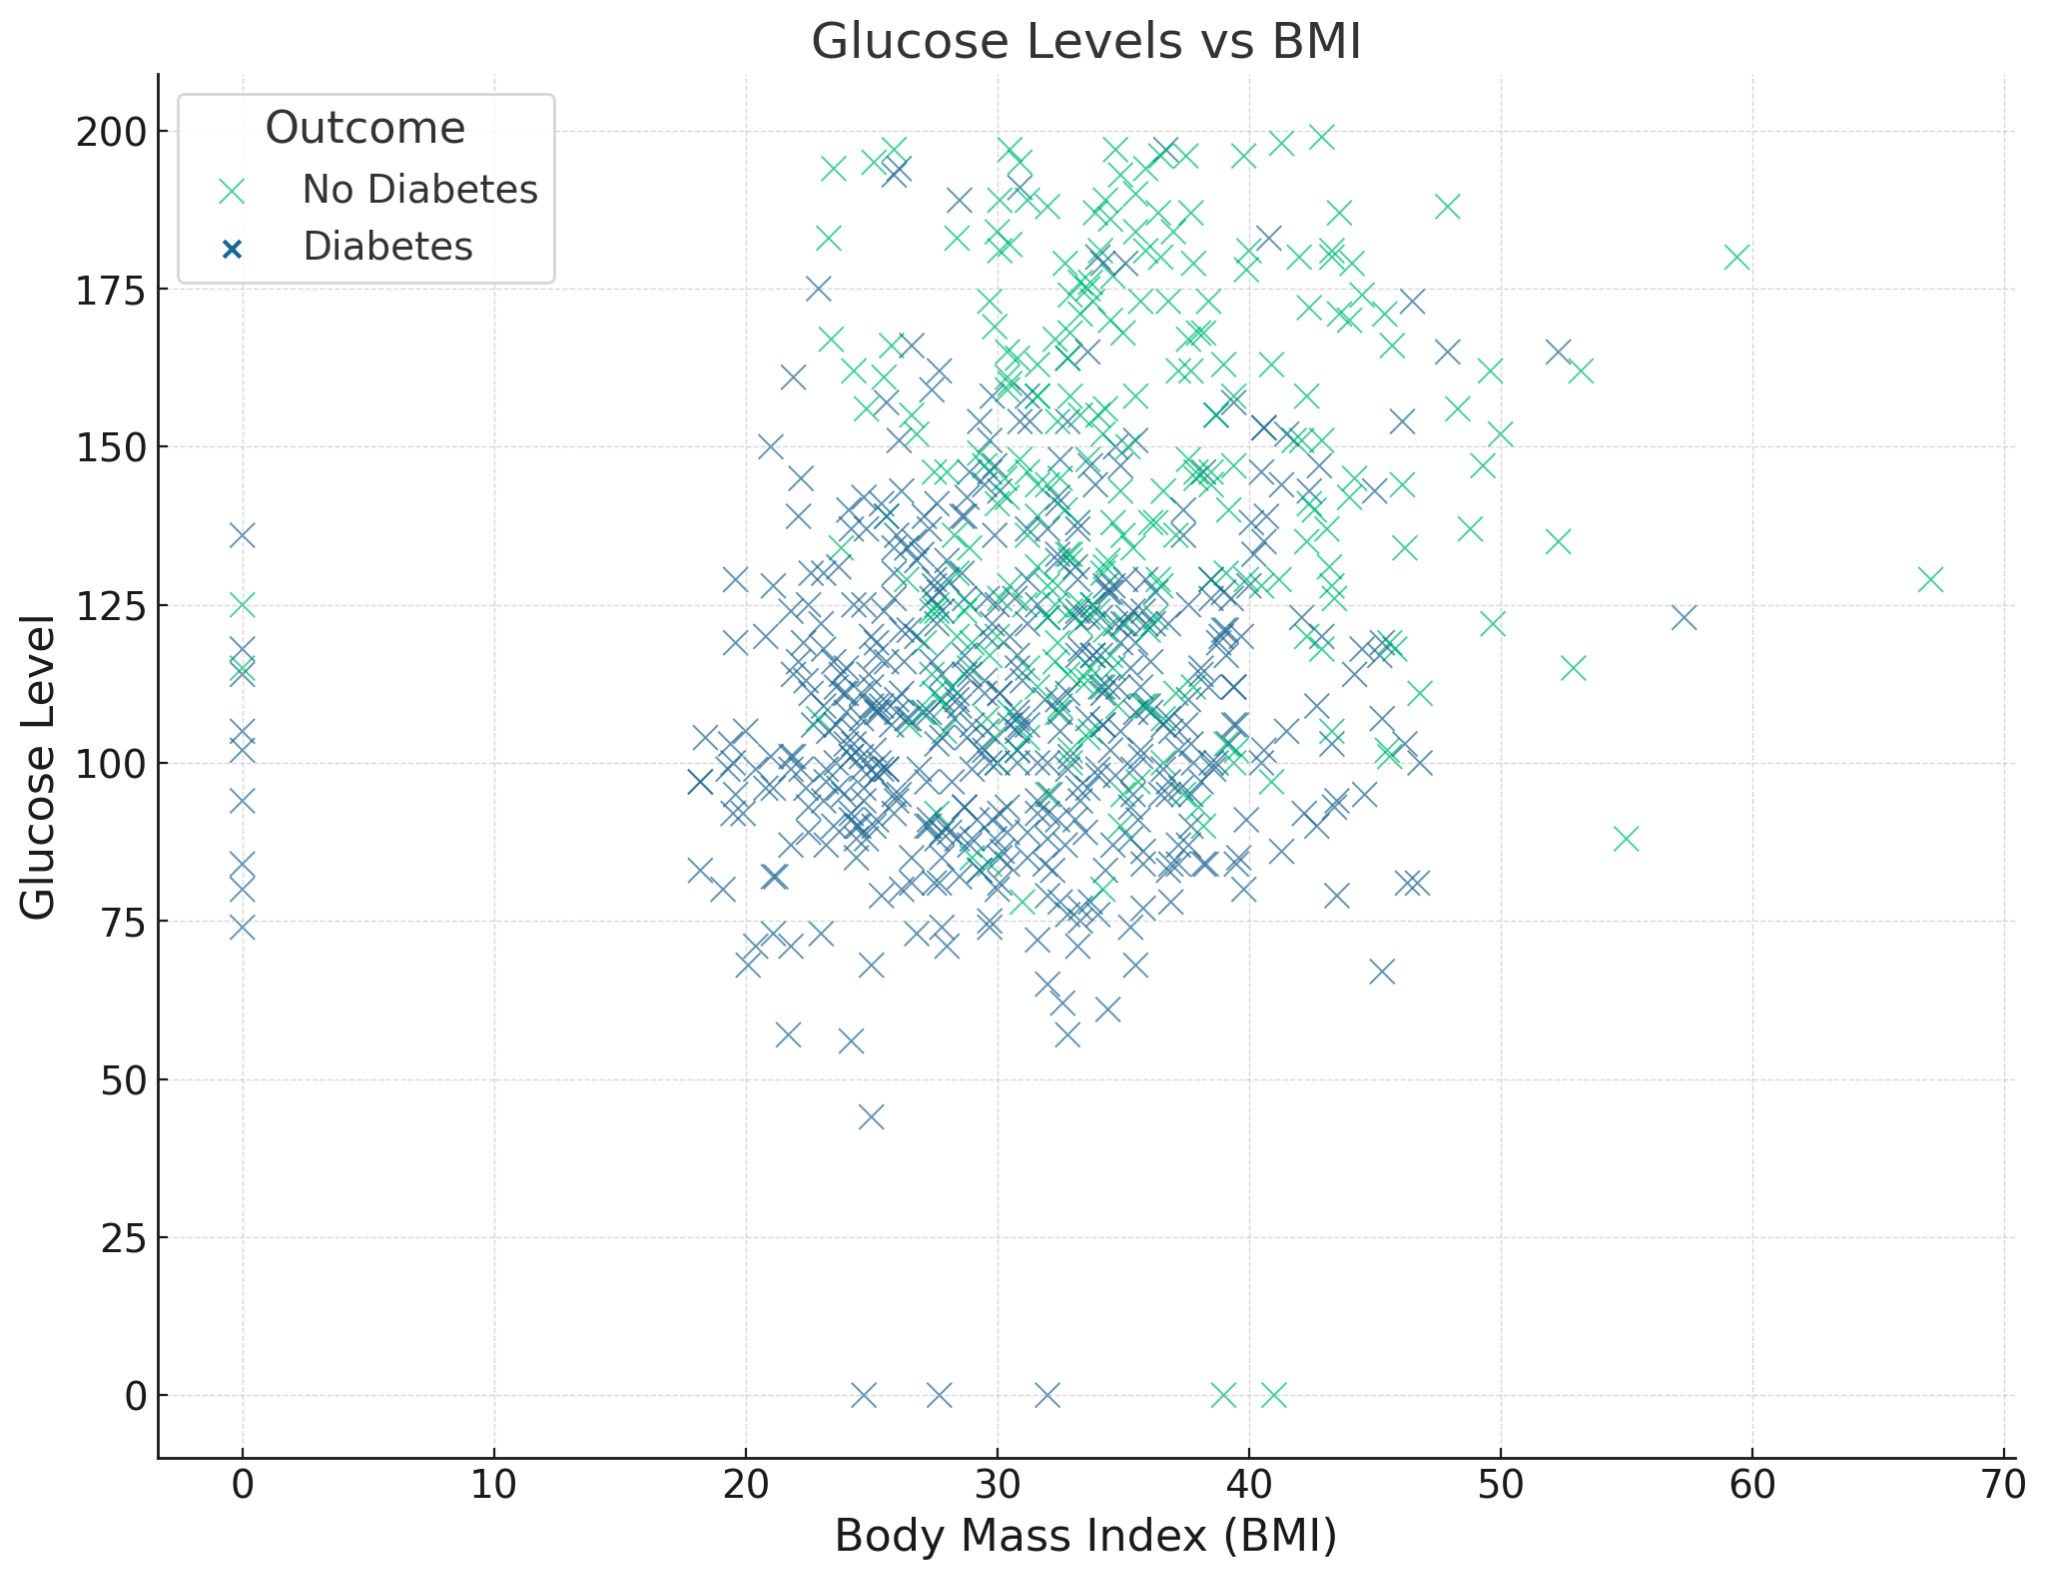
Figure 4. Glucose Levels vs BMI.
4. Conclusion
The present analysis delves deep into a diverse dataset, concentrating on potential determinants linked with the onset of diabetes, particularly in women. From the data, it was surmised that the likelihood of developing diabetes is potentially associated with factors like Glucose levels, BMI, Age, Pregnancies, Insulin, and the Diabetes Pedigree Function, some of which might have been underemphasized in earlier studies. While the study’s insights are significant, it’s imperative to note its limitations. Owing to the finite data scope, there could be inaccuracies in the model, and the sample doesn’t encapsulate all age groups and ethnicities, potentially affecting the results’ precision. Yet, the merits of this research are undeniable. The study adopts a pioneering methodology, amalgamating visual tools for an intuitive understanding and employing logistic regression, ensuring a holistic analysis compared to traditional single-factor methods. More than the well-documented factors like Glucose and BMI, the analysis brings to the fore possibly overlooked aspects like the Diabetes Pedigree Function. The implications of these findings could be paramount for future research, focusing on early detection and intervention, thereby elevating the quality of life and prognosis for diabetic patients.