


1. Introduction
Driving is the most common way of transportation nowadays. Almost every household has a car. People go to work, go shopping, go to restaurants, and go to hang out with their friends by car. People use cars to take them almost everywhere in daily life. However, along with the convenience and high productivity they bring to society, automobiles also bring threats to human lives due to car accidents. According to the National Highway Traffic Safety Administration (NHTSA), approximately 42,915 people died in 2021, and approximately 38,824 people died in 2020 due to motor vehicle accidents in the United States. The causes of car accidents include intoxication, weather, speeding, drunken driving, drowsy driving, and so on. Drowsy driving, the one that we are the most interested in, shows severe damages and significant fatalities according to the data we gathered from official websites. According to NHTSA, around 800 people died and 50,000 people were injured in 2017 in the U.S. due to accidents that happened for drowsy driving. The fatality fluctuates around 800 people from 2011 to 2018 in the U.S. The Governors Highway Safety Association estimated the annual societal cost of car accidents due to drowsy driving is approximately 109 billion dollars. Except for the driver’s personal lifestyle, we believe the use of autonomous cars leads to lower participation in driving, and drivers are thus less focused. As a result, they get drowsy more easily than driving regular cars. The reason why we decided to explore drowsy driving is that studying the brain’s different levels of drowsiness leads us to explore the various consciousness states of the brain which tells us more about the brain’s function [1-3].
Briefly introducing two of the most important methods we used in our paper, we utilized the electroencephalogram and convolutional neural network. In “EEG-Based Driving Fatigue Detection Using a Two-Level Learning Hierarchy Radial Basis Function” (Ren Z et al., 2021), the researchers introduced three methods for drowsiness detection. The first one is psychology based, which means distributing questionnaires to drivers to record their level of drowsiness. The second method is video based, which monitors the behavioral and physical status of drivers to assess their level of drowsiness. The last method is the physiological approach, which is using EEG to assess the brain’s state. EEG is accurate and sensitive, so it measures the brain’s status instantaneously with few errors. Also, EEG is a non-invasive measure, so it would not harm the drivers while measuring their brain states. In our paper, EEG is one of the primary methods that we would use in exploring the brain [4-8].
In addition to EEG, we used the Convolutional Neural Network (CNN). The Convolutional Network is “a neural network with multiple layers used for image processing, classification, and generating correlation,” and its convolutional layer “enables CNN to learn from image or image-like data” (Polo Club of Data Science, CNN Explainer 2021). In our paper, we used CNN to process and classify images. Combining EEG and CNN, in our paper, we first classified different states of drivers’ consciousness, then we generate heat maps based on measurements we got from EEG. Lastly, we classify these heat maps using CNN. With these two advanced technologies, our results would be accurate [9-12].
2. Methodology
2.1. Dataset
The dataset we use in this paper is a collection from 5 participants of a total of 25 hours EEG recording acquired from EMOTIV device, it consists of 34 experiments using a passive brain-computer interaction interface (BCI) to monitor individual human attention. The sampling rate is 128Hz. The experiment is to control a train for 35-55 min in a computer simulation program. There are three mental states examined in this experiment: focused, unfocused and drowsed. The focus state approximately occurs in the first 10 min, unfocused in the second 10 min and the drowsed state in the left time.
In the focused stage, participants pay close intention to controlling the train. In the unfocused stage, participants stop following the simulator but they can’t close their eyes. In the drowsed stage, participants can relax or close their eyes. The data collected from these 7 channels: F3, F4, Fz, C3, C4, Cz, and Pz were useful.
2.2. Data processing
First we apply Fast Fourier Transform(FFT) to transform the time domain data to frequency domain. Second, we apply Hanning Window to help reduce the spectral leakage. Then we divide the amplitude into theta (4-8Hz), alpha (8-12Hz), and beta (12-40Hz) ranges. At last, the 3 values were made into a 2D head map using Azimuthal Equidistant Projection (AEP) method, making it clear to see the distribution and differences of the brain reaction when dealing with different cases.
2.3. Convolutional neural network
Convolutional neural network is a kind of feedforward neural network. Artificial neurons can respond to surrounding units and carry out large-scale image processing. Convolutional neural network includes convolutional layer and pooling layer.
Like traditional neural network/machine learning, the model requires input preprocessing operations. The input layer is used to preprocess the data.
Convolutional layer uses "convolution kernel" for local sensing. Local perception, which means in the process of picture recognition, the human brain does not recognize the whole picture at once. Instead, it first perceives each feature in the picture locally, and then conducts comprehensive operation on the local area at a higher level to obtain global information.
The excitation layer is actually a nonlinear mapping of the output of the convolution layer.
Pooling layer, also known as under sampling or down sampling. It is mainly used to reduce the feature dimension, compress the number of data and parameters, reduce overfitting, and improve the fault tolerance of the model.
After several times of convolution + excitation + pooling, the output layer is finally reached, and the model will fully connect the layer with a high-quality feature picture learned.
3. Experiment & discussion
3.1. Data transform
For EEG signals, we should pay attention to the relationship between the collected data and the acquisition location. We project the sampling points vertically onto a two-dimensional plane, thus forming an EEG signal data area. When the points in this area are assigned with the sampled data, a three-dimensional data frame can be obtained. In order to visualize each data frame, we set up an exercise with sampled data and RGB colors to produce data images with colors reflecting the size of the data (figure 1).
The data is divided by the gamut to obtain the color of each pixel, and the data of each point are combined to generate an image.
\( D=\frac{x}{{x_{max}}} ×{D_{max}} \)
In the above formula, D represents the value of RGB color, Dmax represents the color gamut, x represents the value of a data point, and xmax represents the maximum value of all data points.
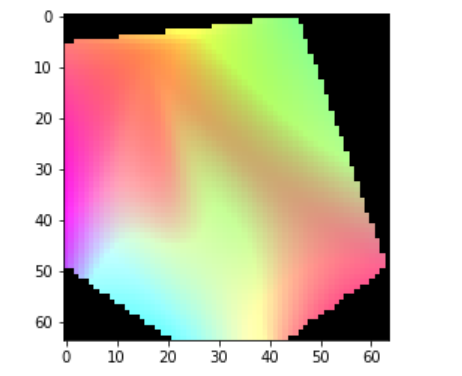
Figure 1. Image transformed from EEG signal.
3.2. Comparison
Compared with our method, the classification accuracy of traditional machine learning-based methods, such as SVM, is not satisfactory. In the previous study, the classification accuracy of 3664 samples trained by SVM method can reach 96.38%. However, when the number of samples is reduced to 786, the test accuracy is only 86.59%. In practice, it is difficult to so many samples collected on users, and CNN method can solve the problem, in our study, five samples and using only the 200 iterations can make the classification accuracy reached 83.49%, and the classification accuracy will be increased with the increase of the number of iterations, this method is more suitable for application in embedded system.
When the same classification method is used, the classification accuracy of CNN increases with the increase of the number of iterations, reaching 75.92% at 100 iterations and 83.49% after 200 iterations (figure 2).
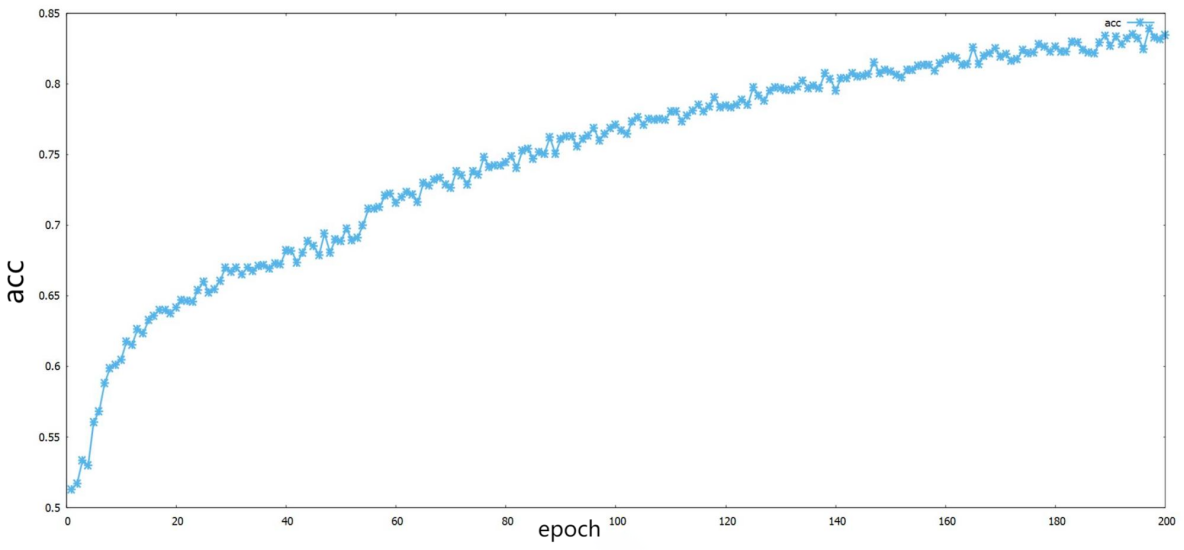
Figure 2. Scatter plot of accuracy.
The accuracy increases with the number of iterations. When the number of iterations reaches 200, the accuracy has reached 83.49%。
4. Conclusion
In this study, we have illustrated an efficient method to detect drowsiness using CNN trained on an image-based EEG signal dataset, which can be further used in accident prevention while the vehicle is under autonomous driving condition.
The main purpose of this study was to test whether the EEG signals after transformed into images were suitable for CNN to classify. Our model achieved accuracy over 83%, successfully recognize the occurs of participants’ drowsiness.
However, our study was carried out based on a dataset whose participants were told to use a train simulator instead of a car, which could have the inconformity in aspects involving signal frequency and amplitude. This problem can be solved with having our own offline experiment and dataset after the restriction of Covid-19.