

1. Introduction
The logistics industry has witnessed a profound transformation, largely driven by advancements in machine learning and artificial intelligence (AI). Over time, technology has evolved from horse-drawn carriages to advanced air and water transport systems, striving to meet the increasing demands of online shopping and logistics management. This paper examines the current landscape of AI applications in logistics, with a particular focus on sorting centers. Traditional approaches, such as Long Short-Term Memory (LSTM) networks—known for their ability to manage long-term data dependencies—have been prominent. However, newer models like the AutoRegressive Integrated Moving Average (ARIMA) are emerging as viable alternatives. This review explores the fundamental differences between these traditional and advanced AI methods, analyzing their operational principles, real-world implementation challenges, and implications for the future of sorting center automation. By comparing both approaches, this study aims to provide industry stakeholders with insights into their respective advantages and limitations, guiding the development of more effective logistics solutions.
Scholars have long addressed challenges in logistics and sorting, offering theoretical foundations that paved the way for the later application of AI in logistics. Notable works, such as The Bullwhip Effect in Supply Chain, highlighted early concerns about logistics planning, which, at that time, relied on manual execution[1]. The emergence of AI concepts brought pioneering changes, exemplified by research like Adaptive Methods in Macroeconomic Forecasting, which compared recursive models and neural network approaches to traditional forecasting methods[2]. Even early models using limited data outperformed established forecasts.
Subsequent advancements in logistics planning, such as Supply Chain 2.0, emphasized the need for more sophisticated allocation schemes, anticipating future AI developments[3]. Strategic planning also became crucial in addressing operational issues, including labor costs and cargo volume forecasting. Theoretical contributions, such as Designing and Managing the Supply Chain and Supply Chain Management: Strategy, Planning & Operation, compiled strategic insights into planning and operations, which—although somewhat outdated—remain foundational to modern supply chain theory[4][5].
The integration of AI into logistics gained momentum with the design of real-time knowledge-based systems (RKBS). These systems, as exemplified by RKBS for Logistics Service Providers, marked the beginning of AI-based decision-making and planning in warehouse operations[6]. The successful application of RKBS in companies like GENCO significantly improved logistics services, laying the groundwork for more advanced AI-driven planning algorithms.
LSTM, introduced by Sepp, initially faced limitations due to inadequate hardware capabilities[7]. However, with advancements in computational power around 2010, such as the development of GPU technology, LSTM became feasible for logistics storage and planning. For example, research by Ilya Sutskever proposed a framework for sequence-to-sequence learning (Seq2Seq) using LSTM, which is widely used in machine translation, text generation and other tasks[8]. The LSTM model has since become a staple in long-term logistics planning, with applications like Logistics Sorting Center Volume Prediction Based on Time Series LSTM its effectiveness in freight volume prediction and improving operational efficiency[9].
The ARIMA model, while relatively new in logistics, has gained traction in recent years. Scholars have explored its application in predicting cargo volume, as seen in A Hybrid Total Logistics Forecasting Method Combined with ARIMA and BPNN, where ARIMA and backpropagation neural networks (BPNN) were combined to forecast logistics trends[10]. This hybrid method capitalizes on the strengths of each model, yielding more accurate predictions. Weng applied ARIMA to time-series data, using second-order differencing to establish an ARIMA (1,2,3) model for route-specific freight volume forecasting[11]. These studies highlight ARIMA's growing relevance in the logistics sector, particularly in scenarios requiring precise, data-driven predictions.
Many of today's data demanders are unable to effectively identify the commonalities and characteristics of the data, so that they cannot choose a more effective model. On the contrary, it will be more effective to use different data under the knowledge of the characteristics of the model, which can not only effectively cost, but also avoid the time-consuming decision of the predicted value after multiple uses of the model.
However, the vision cannot be limited to these two models or the two models as the main body. In the face of increasingly changing technologies and new models, there are new trends and challenges. But the ideas and frameworks of these two models are so classic that they can still be seen in many new models today. Therefore, the data matching model is needed. This article provides examples to show the selection of models for different data, which is of great significance for promoting not only the construction of new models but also the progress of prediction work.
2. Methodology
This study utilizes two advanced time series models, LSTM and ARIMA, to conduct experiments on cargo volume data from different sorting centers. The objective is to determine the specific time series problems each model is best suited for, helping relevant personnel to better identify and select appropriate models.
2.1. LSTM model
The dataset used for LSTM consists of the daily cargo volume from a sorting center located in a small county in China.
2.1.1. Data Processing
The data from multiple sorting center nodes was cleaned and integrated for the experiment. Missing data was imputed by filling in zeros, and outliers were considered valid data points. Time characteristics were preserved without applying denoising or exponential smoothing.
2.1.2. Model Description and Parameters
The Long Short-Term Memory (LSTM) model, known for its ability to capture long-term dependencies in sequential data, was selected to predict daily cargo volumes. The model structure includes cell states and gate mechanisms (forget, input, and output gates) that help retain relevant information while discarding irrelevant details. The key LSTM model parameters used in the experiment are shown below in Table 1.
Table 1: LSTM Hyperparameters.
Parameter | Value |
Number of Features | 1 |
Number of Hidden Units | 150 |
Max Epochs | 300 |
Gradient Threshold | 1 |
Initial Learning Rate | 0.005 |
Learn Rate Drop Period | 120 |
Learn Rate Drop Factor | 0.25 |
2.1.3. Model Training and Implementation
The LSTM model was trained using the cleaned and preprocessed dataset. After training, the model was applied to predict future daily cargo volume based on the past data trends. The predictions and actual observed values were then compared and evaluated.
2.2. ARIMA model
For the ARIMA model, hourly cargo volume data from the same sorting centers were analyzed.
2.2.1. Data Processing
To better understand the data trends, the hourly cargo volume data was visualized, showing the overall trend by aggregating each hour’s data. Key time-dependent patterns such as peak periods and low activity hours were identified, helping to define the ARIMA model's applicability.
2.2.2. Model Description and Parameters
The ARIMA model is designed to capture both trend and randomness in the time series data. The process involves testing for stationarity using the data through differencing to ensure stationarity when necessary.
The ARIMA modeling process includes: 1. Testing for stationarity (ADF test). 2. Identifying the appropriate AR and MA components using autocorrelation (ACF) and partial autocorrelation (PACF) plots. 3. Estimating model parameters through maximum likelihood estimation. 4. Diagnosing the model to check if residuals behave as white noise.
2.2.3. Model Implementation
After fitting the ARIMA model, it was used to predict hourly cargo volumes. The results were evaluated based on the stationarity checks and performance metrics, such as the ADF test values.
3. Results
3.1. Data Visualization
The columns representing different sorting center cleaned up the data by integrating all centers are visualized. Missing data related to goods was addressed by filling in zeros, under the assumption that missing values represent zero volume. Furthermore, we considered outliers as real and valid data, acknowledging their potential importance in reflecting true market or operational dynamics. No time-series denoising or exponential smoothing was applied to maintain the integrity of the original data's variability.
From Figure 1, it can be observed that the daily cargo volume at several sorting centers exhibits an overall upward trend. Most sorting centers show a significant shift on November 1st, with a relatively stable trend prior to that date. This pattern likely reflects operational or market-related changes tied to specific events around that time. To predict future daily cargo volumes, we opted for a deep learning approach, utilizing a LSTM network. LSTMs are particularly suited for this task due to their ability to capture long-term dependencies in sequential data, making them effective for time-series forecasting. After training the LSTM model on historical data, it learns patterns from past daily cargo volumes, enabling us to make accurate future predictions.
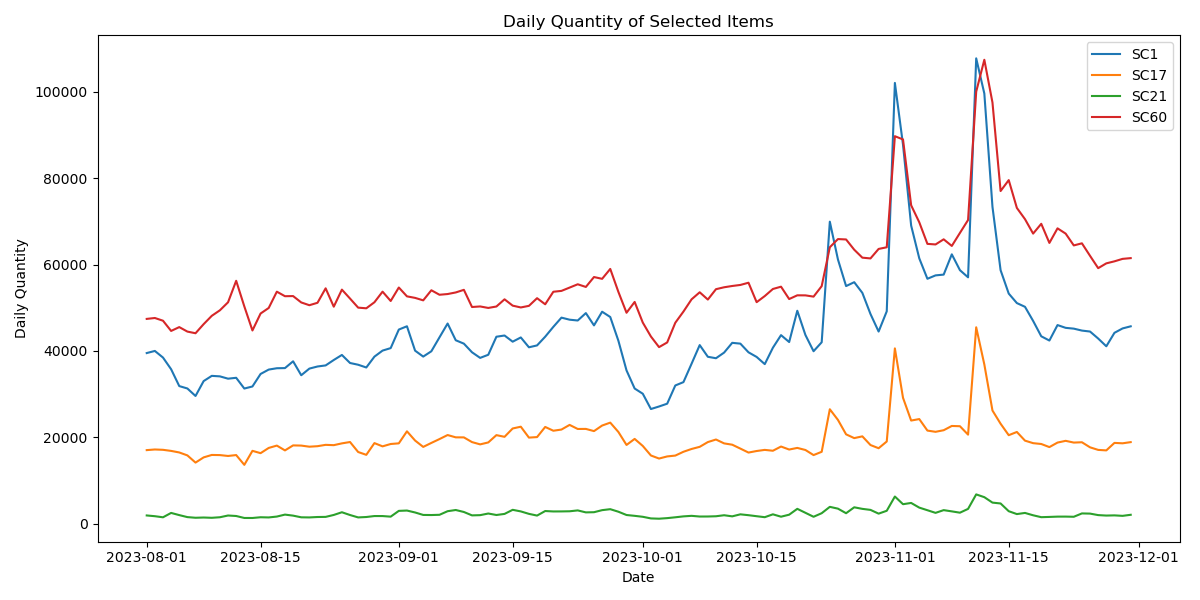
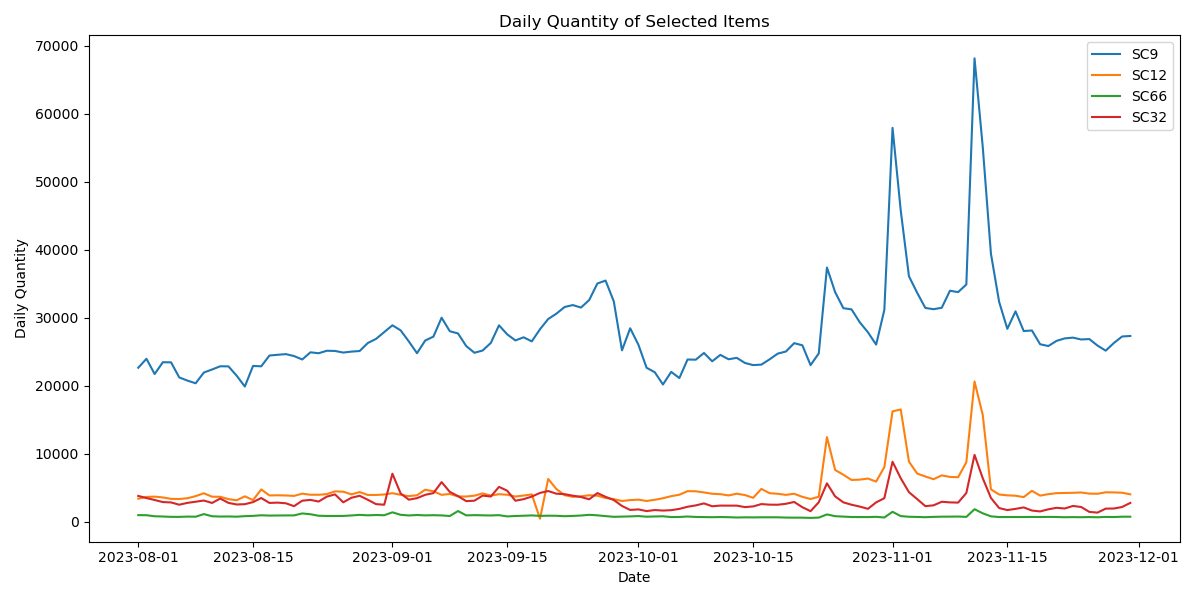
Figure 1: Visualization of the daily trend of average cargo volume at some sorting center points.
3.2. Volume forecast
From Figure 2, we can observe that the LSTM model generates a series of predicted cargo volumes for the coming days. These predictions demonstrate a certain degree of volatility, which may be attributed to the inherent uncertainty in cargo volume, influenced by external factors. The fluctuations likely reflect the potential impact of unpredictable events such as operational disruptions, holidays, or promotional campaigns. While the LSTM predictions align closely with actual values for most time points, there are noticeable deviations in some periods. These deviations can be explained by unexpected factors in real-world operations, such as emergencies, unforeseen demand spikes, or changes in logistics patterns that the model may not fully capture. Despite these deviations, the overall predictive performance suggests that the LSTM model can provide valuable insights into future cargo volume trends.
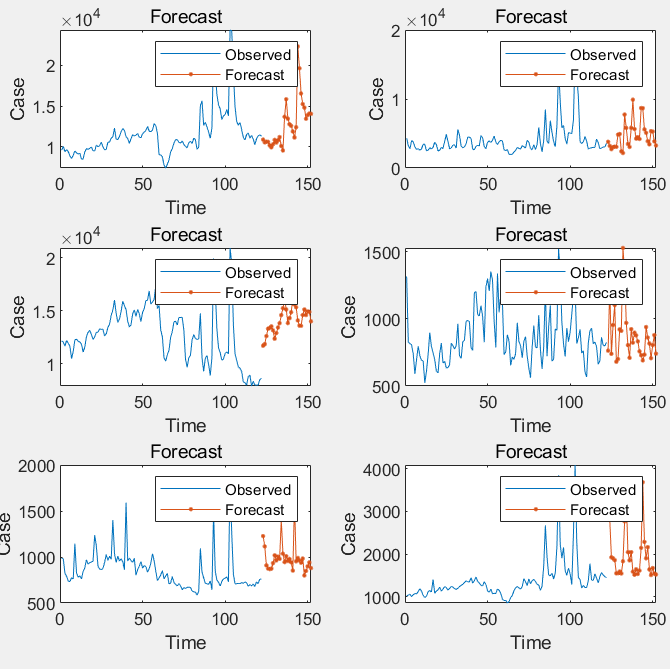
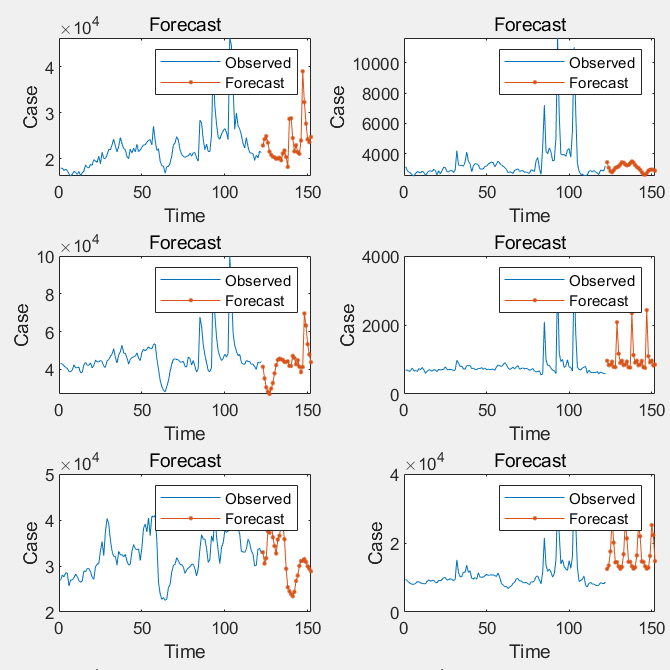
Figure 2: LSTM prediction results.
3.3. ARIMA dataset
Similarly, visualizing the daily cargo volume data for sorting centers helps us better understand the time dependencies and relationships within the data. By summarizing and visualizing the hourly cargo volume across multiple sorting centers, we can observe the overall hourly trend by aggregating the volume for each hour. Based on the individual sorting centers and their corresponding aggregated results (as shown in Figure 3), the lowest cargo volume is observed between 6 AM and 8 AM. After this period, the total cargo volume increases steadily throughout the day. The highest peaks occur around 2 PM and 9 PM, after which the volume begins to decline. This pattern aligns with typical temporal trends in logistics operations, consistent with the time-dependent characteristics captured by the ARIMA model. The observed trends reflect operational rhythms, such as workforce shifts, customer demand, or other time-specific factors influencing cargo volume throughout the day.
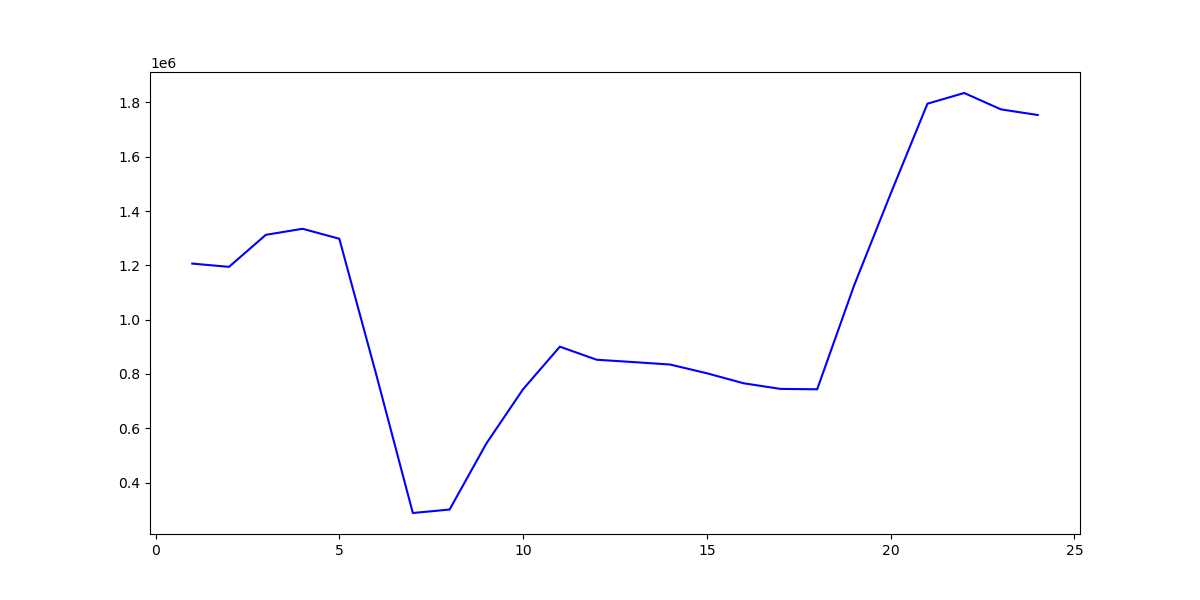
Figure 3: Hourly Total Cargo Volume Trend.
3.4. ARIMA hourly volume forecast
With the support of theory and models, we simply input the data. It can be inferred that the ARIMA model requires the time series to exhibit stationarity. By conducting the Augmented Dickey-Fuller (ADF) test and analyzing the t-value, we can reject the null hypothesis of non-stationarity with a significance level of P < 0.05. Taking one sorting center as an example, the ADF test results—along with relevant variables such as the differential order, t-test results, and AIC values—are summarized in Table 2.
When the series is in its original form (differential order = 0), the ADF test shows a t-value of -4.212 with a significance level of P = 0.001 (***), indicating stationarity at this level and allowing us to reject the null hypothesis of non-stationarity. For the first-order difference (differential order = 1), the t-value is -4.447 with a P-value of 0.000 (***), again indicating significance and rejecting the null hypothesis. The series is stationary. With the second-order difference (differential order = 2), the t-value drops further to -7.036, with a P-value of 0.000 (***), confirming stationarity at this level as well. These results indicate that the time series of cargo volume is stationary after differencing, and thus, suitable for ARIMA modeling.
Table 2: ADF Test Results for Sorting Center.
Parameter | Differential Order | t-value | P-value | AIC | Critical Value (1%) | Critical Value (5%) | Critical Value (10%) |
Sorting Center | 0 | -4.212 | 0.001*** | 1404.346 | -3.512 | -2.895 | -2.585 |
Sorting Center | 1 | -4.447 | 0.000*** | 1402.347 | -3.503 | -2.895 | -2.585 |
Sorting Center | 2 | -7.036 | 0.000*** | 1401.328 | -3.504 | -2.894 | -2.585 |
The prediction results based on the ARIMA model for the sorting center parameter are shown in Figure 4. The advantages of the ARIMA model, particularly when compared with LSTM in aspects such as speed, scope of application, accuracy, and the unique characteristics of each algorithm. By comparing both models, we can highlight their respective strengths in logistics and transportation. LSTM is highly effective at handling long-term dependencies and capturing complex relationships in time-series data. Its flexibility allows it to fit diverse environments, making it ideal for scenarios with non-linear trends or complex patterns in cargo volume over time.
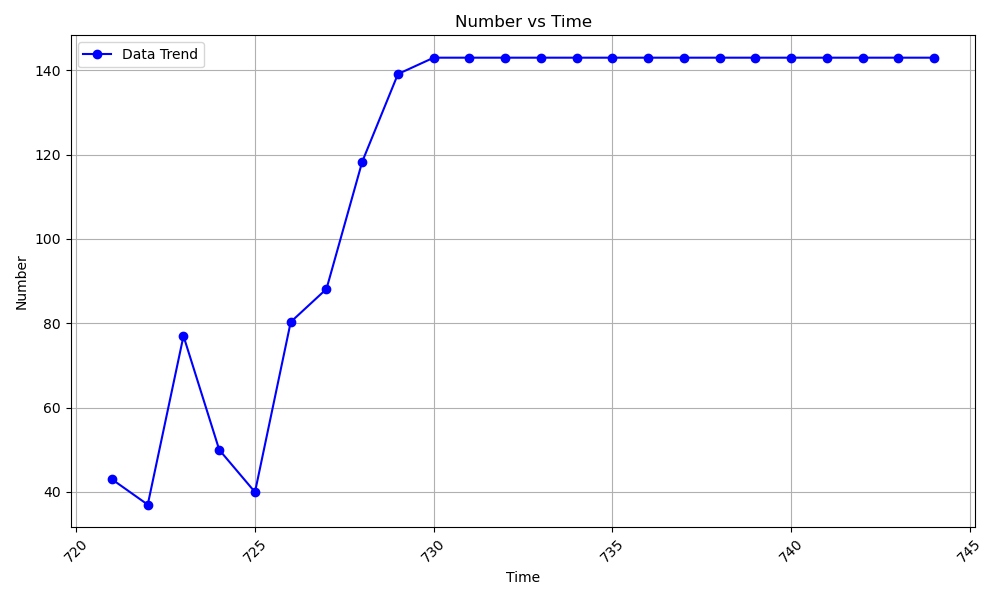
Figure 4: Model Prediction Results for Sorting Center.
4. Discussion
4.1. Data Enlightenment
According to the results of the two experiments, it can be clearly seen that under the premise of meeting the requirements of time series, ARIMA can be used to predict short-term multi-frequency or linear data, LSTM or an improved model based on it can be used for long-term data that need to capture time-dependent relations. Through the performance of the two in the corresponding data set, the difference between the classical statistical model and the deep learning model can be triggered, which is related to the needs of real society, and can be inspired by the construction of multiple models for complex problems.
4.2. Experimental drawbacks
Looking back at the whole process and considerations after the experiment, there are the following several aspects need to be improved. In this experiment, the data is only obtained and then predicted and compared. In practical applications, different engineering projects or forecast schemes will generate costs, so a more optimized scheme can calculate the use of the model and the cost of all aspects, to optimize the model selection and scheme of prediction. No matter what kind of statistical classic model or short-term prediction model, if there is sufficient data and time, deep learning will still get more accurate prediction values and solutions, so time costs and other factors should also be considered when determining models and solutions. External Constraints
4.3. Future directions
With the continuous development of deep learning technology, the field of time series prediction will also usher in more innovations. Here are some possible future directions:
Combine different types of deep learning models, such as RNN, CNN, and Attention, to make full use of the advantages of various models. Hybrid models can better capture complexity and trends in time series and improve prediction accuracy.
Study based on the dynamic changing characteristics of time series data. For example, parameters such as adaptive network structure and learning rate can be used to adapt to changes in time series can make full use of existing data sets and models and rely on new domain data.
5. Conclusion
This study highlights the significant role of AI in transforming the logistics industry, particularly in sorting centers, by comparing two advanced time series forecasting models: LSTM networks and ARIMA. LSTM excels in handling complex, non-linear trends and long-term dependencies, making it highly effective for dynamic cargo volume data. In contrast, ARIMA is advantageous for stable, stationary data, offering speed and simplicity in its predictions. The choice between these models depends on the specific characteristics of the data and operational needs. Ultimately, this analysis provides valuable insights for industry stakeholders, guiding them in selecting appropriate forecasting methods to enhance logistics efficiency and decision-making.