


1. Introduction
Cardiovascular disease (CVD) is the world's leading cause of death, claiming an estimated 17.9 million lives annually and accounting for 31 per cent of all deaths worldwide. According to the 2020 National Health Commission statistical report, the rate of cardiovascular disease in China is increasing. According to research results, cardiovascular disease has become the leading cause of death among Chinese residents, accounting for 44.8 per cent of all deaths in rural areas and 41.9 per cent in urban areas. One in five adults suffers from cardiovascular disease, and the proportion of those suffering from the disease has been increasing year by year, and with the increasing number of an ageing population in China and a rising standard of living, the incidence of risk factors for cardiovascular disease has shown a substantial upward trend, leading to a growing number of cardiovascular disease patients [1]. As China's aging population grows and living standards continue to improve, the incidence of cardiovascular disease risk factors is on a substantial upward trend, leading to a gradual expansion of the cardiovascular disease population. Most cardiovascular diseases can be prevented by addressing behavioural risk factors such as smoking, poor diet and obesity, physical inactivity and harmful alcohol consumption, using population strategies. People who have coronary heart disease or are at high cardiovascular risk (due to the presence of one or more risk factors, such as high blood pressure, diabetes, hyperlipidemia, or a diagnosed condition) should be identified and managed as early as possible. Due to multiple factors interfering with the diagnosis of in-hospital doctors, such as: the lack of clinical experience of the doctor, or the subjective judgement of the doctor and the misdiagnosis of the similar condition, etc., there may be a large error. Therefore, we need a high-precision and high-efficiency method for diagnosis. In traditional medicine, especially in cardiovascular diseases, which have a very high incidence these days, AI can not only support diagnosis and treatment for patients, but also maximize traditional risk assessment models for doctors to predict disease development, which provides more convenience and new perspectives for clinical practice [2].
And to determine whether the patient's test results are cardiovascular disease, machine learning algorithms can help us make effective predictions [3]. Machine learning has been used in practice with good results, Lian used the perceptron algorithm of machine learning to analyses the relevant features of cardiovascular disease in the test subject, and finally completed the auxiliary diagnosis of whether the disease occurs or not [4]. Krishna Kumar et al. proposed the use of machine learning models to identify patients with heart disease based on their medical condition and used curve fitting and artificial neural networks (ANN) to model the patient's condition to determine whether he or she is suffering from heart disease [5]. Mohammad Shehab mentioned the use of ML in medicine for tumors as well as medical imaging , and comparative analysis using different models like logistic regression, random forest, decision tree, KNN [6-7] .The present study proposes a random forest-based model for heart disease prediction and compares the performance of this model with other machine learning models.
2. Methods
2.1. Data sets
By referencing the Kaggle dataset and performing segmentation analysis, data processing, model building, model evaluation, model tuning, model application, 25 characteristics in terms of age, sex, blood pressure, smoking, heart rate, disease, cholesterol level (serum cholesterol), maximum heart rate (thalamus), presence of exercise-induced angina, and a variety of metrics related to electrocardiogram findings, type of chest pain, and thallium stress test. A total sample of 2280 cases were used to predict the occurrence of heart disease. In practice, patients can be analyzed by their past and present medical history to determine whether they are at risk of developing cardiovascular disease, so that early intervention can be made to prevent and prepare for emergencies such as heart attacks.
2.2. Modelling
Random forest (RF) is a supervised learning algorithm for classification and regression problems. It is an integrated learning method based on multiple decision trees samples for training and prediction. Features of Random Forest include the ability to handle large numbers of input variables, assess variable importance, reduce overfitting, and allow for unbiased estimation of generalization error internally.
In principle, Random Forest works by randomly selecting a subset from the training dataset during the training phase and randomly selecting a portion of the feature attributes to build each decision tree. This process is repeated several times until a specified number of decision trees are constructed. In the prediction phase, predictions are made for each decision tree, and then based on the predictions of all the trees, a voting or averaging to get the final prediction.
Advantages of random forests include the ability to produce highly accurate classifiers, handle a large number of input variables, assess variable importance, and internally produce unbiased estimates of the error after generalization. In addition, due to the use of randomization techniques such as random sampling and random selection of features, random forests can reduce the sensitivity of decision trees to the training data, thus preventing overfitting.
Random forest is a model that improves prediction performance by integrating multiple decision trees with high accuracy and robustness. Its core idea is to put a large number of trees together to avoid fitting and improve accuracy. Its structure is shown in Figure 1 [8].
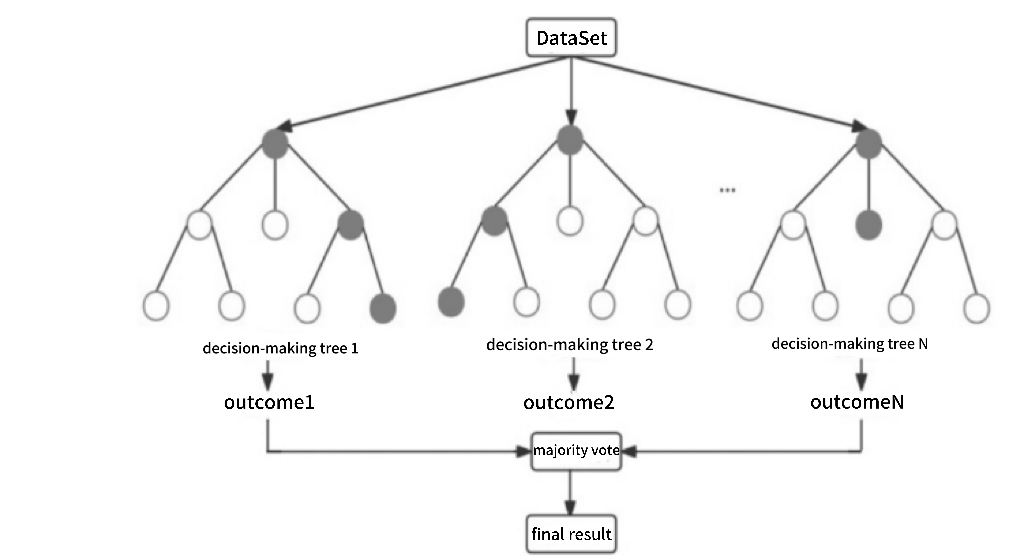
Figure 1. Random forest structure diagram
The dataset was compared using five data analysis methods (logistic regression (LR), decision tree, neural network, Adaboost). Logistic regression is a simple and easy to interpret model for binary classification problems. Its performance depends on the linear divisibility of the data and may perform poorly for non-linear problems. Decision trees are capable of handling non-linear relationships and can handle many features. However, they are prone to overfitting and need to be pruned to avoid overfitting. Neural network is a very flexible model that can learn non-linear relationships and can handle large scale datasets. Adaboost is also an integrated learning method that improves accuracy by combining multiple weak classifiers. But it is more sensitive to noise and outliers. By out comparison, Random Forest and Neural Network have better performance in cardiovascular disease prediction, especially when dealing with non-linear relationships and large-scale datasets, weighing training time and model complexity. The neural network model results were analyzed with up to ninety-five per cent correctness.
With 90% of the training set and 10% of the test set at 3 training sessions, the graphical visualization shows that heart disease is more likely to occur between 58-60 years of age, when suffering from caa, or an increase in st-segmentation induced by exercise, and is more prevalent in males than in females.
2.3. Assessment indicators
The text describes the assessment indicators for random forests as follows. Accuracies (precision):Accuracy is the ratio of the number of samples in which the model predicts correctly (including true positive examples TP, true negative examples TN) as a ratio of the number of samples to the overall number of samples. Accuracy is the simplest and most intuitive metric in classification problems, but it is not much used in practice. The reason is that when the distribution of sample labels is not balanced, for example: the proportion of positive samples is 99%, as long as the model predicts all the samples as positive samples, the accuracy rate reaches 99%, but in fact, the model has no prediction ability at all.
The search rate, also called Precision, is easily confused with Accuracy. Accuracy is from the point of view of predicting positive instances. The check rate evaluates the accuracy in the positive examples predicted by the model, accuracy is more important. If we raise the threshold so that fewer positive cases are predicted and the accuracy of the prediction is higher, then the check rate becomes higher, so a single check rate metric is still not an accurate assessment of the model's performance. This is because the model misses a large number of positive cases, causing a large number of positive cases to be misclassified as negative.
The check rate, also called the recall rate (Recall), is from the point of view of the actual positive examples (real examples, false counter-examples). Recall is evaluated against a sample of positive examples, indicating how many of the positive examples in the sample were predicted correctly - fewer omissions are more important to be complete. Suppose we lower the threshold, it will make the number of samples predicted as positive examples increase, but the check accuracy rate will decrease. So, the contradiction between the rate of checking accuracy and the rate of checking completeness is related to the threshold.
Accuracy and recall are conflicting metrics. In general, when accuracy is high, callbacks tend to be lower, and when accuracy is low, callbacks tend to be higher. Where the classification confidence is high, the accuracy is high; When confidence in classification is low, recall rates are higher. In order to be able to combine these two measurement methods, F-measure(weighted average of accuracy and callbacks) is proposed. These formulas are an important part of the random forest algorithm, and use this information to measure the parameters of the unclean isentropic and overall sample classification accuracy, as well as to guide how to construct each tree and make the final decision for classification.
3. Results and discussion
After experimenting with the same dataset, it can be found that Random Forest has the highest accuracy rate of about 83.61% (Table 1 and Figure 2). RF has the highest value, and RF produces the most accurate answer by constantly voting through multiple decision trees The advantages of this model are also more obvious: Principles of the Random Forest Algorithm and its Application in Clinical Research proposes that high dimensional data can be handled by dimensionality reduction and the importance of each predictor variable can be assessed according to the selection of the final variable in each classification tree. And multiple processes can be carried out at the same time, with a high computational efficiency and a fast-learning process. For the prediction of multiple profiles, a highly accurate classification model can be generated, and the accuracy can be maintained high in the presence of missing profiles. high accuracy can be maintained. The disadvantages are mainly that if a variable is more categorized, it has a greater impact on the random forest and may also produce overfitting in classification or regression. The model can be used to filter out important predictor variables, and then other methods can be used to build predictive models [9]. Such methods can quickly locate a patient's risk of developing cardiovascular disease, and can reduce the need to travel to hospitals and other complex check-ups by using the patient's daily physical condition and medical diagnosis or daily recordings such as smartwatch bracelets, and prompting the user through a mobile phone app [9]. This plays a good role in the prevention of cardiovascular disease and simplifies the examination process.
Table 1. Description of the results.
Accuracy | Precision | Recall | F1 score | |
AdaBoost | 80.33 % | 88 % | 72 % | 79 % |
RF | 83.61 % | 89 % | 78 % | 83 % |
KNN | 81.79 % | 89 % | 72% | 81% |
XGBoost | 80.33 % | 86 % | 75 % | 80 % |
LR | 81.97 % | 84 % | 81% | 83 % |
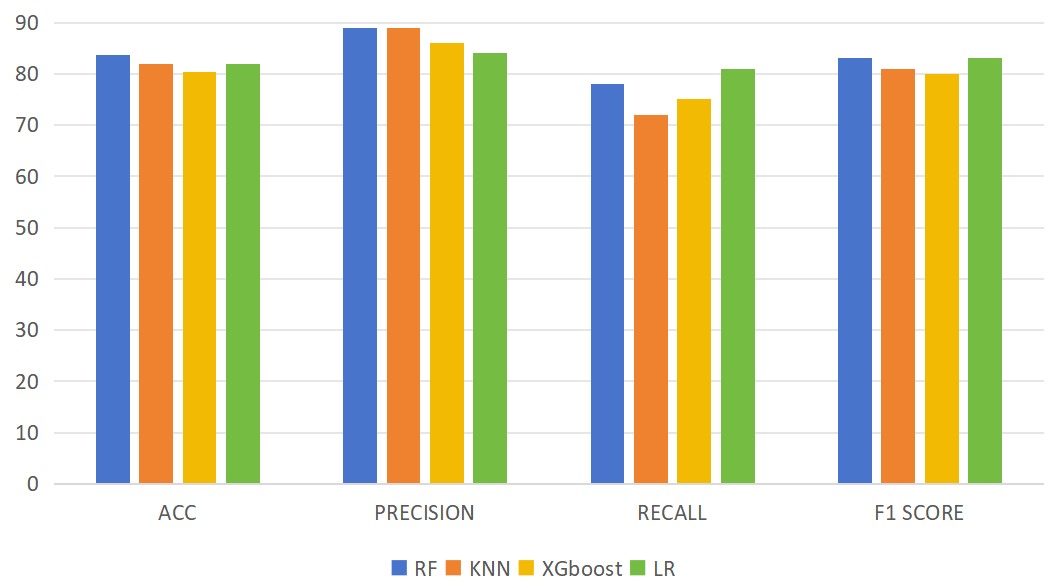
Figure 2. Histogram of results.
Small number of datasets may be subject to chance and need to be analyzed from multidimensional data. Low penetration of AI technology in mass life and not accessible to most groups due to economic situation and lack of coverage of special populations in the dataset should be further solved. Currently there is less relevant data and less relevant feature items, which leads to insufficient data and low quality of the study. The model predictions are not well developed and there are fewer model pairs used, which makes it difficult to deal with all the scenarios that can happen. Although Random Forest and Neural Networks can predict well and have a good accuracy, considering the rigor of the model predictions and the fact that it is used in the healthcare field, to solve the above problems, more features and more examples need to be documented and more models need to be simulated for comparison to find out the results. results with higher accuracy and compare and analyze all the model results.
4. Conclusion
In this study, five models were used to compare the accuracy of RF. The metrics of RF was 83.61% for accuracy, 89% for precision, 78% for recall and 83% for F1score. Based on random forest algorithm, the feature selection problem of large-scale cardiovascular disease data sets can be solved. The early manifestation of cardiovascular disease has always been a problem that is very easy to overlook, and in this study, the advantages of random forest algorithms in many models are presented. The random forest model performed well in the characteristic phase data set for the prevention of cardiovascular disease, providing new insights and directions for predicting the occurrence of early cardiovascular disease, and providing new measures for the prevention of cardiovascular disease. Through this study, it is hoped that RF-based model will contribute to the medical field in the future.