


1. Introduction
With the development of urban areas, the issue of stray animals on the streets is becoming more and more prominent, especially stray cats and dogs. These homeless animals often roam in environments where no one takes care of them [1]. Due to a lack of stable food sources, they easily get hungry and sick. This not only threatens their own survival but may also increase public health and safety risks. Therefore, a system that can automatically identify and provide appropriate food for stray animals is crucial [2]. Such a system can not only meet the basic living needs of stray cats and dogs but also reduce various social problems they cause while searching for food. Hence, researching and designing a system that can accurately distinguish between cats and dogs and feed them automatically is not just an animal welfare issue but also a deep reflection on current urban management and social responsibility [3,4].
People have tried various methods to address the feeding of stray cats and dogs. Firstly, many places have established animal shelters and rescue centers. These centers not only provide food and medical care for stray animals but also carry out sterilization procedures to control their reproduction [5,6]. In addition, many communities and volunteer groups regularly offer food and care to stray animals on the streets. Technologically, some have designed animal recognition systems based on traditional image processing techniques. These systems distinguish between cats and dogs by analyzing animal morphological characteristics, such as size, color, and texture [7]. However, their accuracy is usually low in complex environments. There are also some automatic feeding robots that are set up in fixed locations and can release food at set times for animals to eat, but these robots typically can't differentiate between different animals. Recently, there have been tried to use simple deep-learning techniques to animal recognition, but due to the complexity of the models and limitations in training data, these attempts still face some challenges in practical applications [8,9].
To deal with this challenge, the study targets to design and implement a high-precision automatic feeding system based on the Detectron2 deep learning framework [10]. By collecting a large number of cat and dog images and using Detectron2 for model training, author expects the system to accurately identify stray cats and dogs on the streets and provide them with appropriate food. This not only meets the basic needs of stray animals and reduces food waste, but also offers the possibility of creating a harmonious coexistence environment between humans and animals. In summary, by applying advanced deep learning techniques, this study provides a practical solution to an urgent real-world problem, aiming to promote harmonious coexistence among humans, animals, and the environment.
2. Methodology
2.1. Dataset description and preprocessing
Detectron2 supports custom datasets [11]. In Detectron2, dataset is needed: provide the image path and annotations according to the data format, and then register the dataset's meta data. Detectron2 registers datasets in the following manner: A list of dictionaries is returned, which contains information about an image in dataset. The data can be loaded and interpreted as a dictionary. A single dictionary represents one image and its annotations. It should be provided according to the annotation format and mainly includes the following fields (for more details, refer to Standard Dataset dictionary): The absolute path to the image; The height and width of the image; The unique ID for the image; Each dictionary represents the annotation information for an instance, such as the box and mask.
For instance, it mainly needs to include the following fields: Object annotation box, consisting of 4 floating-point numbers; Format of the box is integer; Category label, an integer in the range from 0 to the number of the data. Generally, Detectron2 sets the background class;
2.2. Proposed approach
Using Detectron2 to distinguish between cats and dogs, the process of distinguishing requires 5 steps. First, build the network model. The model is constructing a detectron2 networks. The model is built sequentially, layer by layer, starting with a convolutional layer with a 3x3 kernel and Relu activation function, and this pattern repeats for several layers, increasing the number of filters from 32 to 128. After the final max pooling layer, a flatten layer is added to transition from convolutional layers to fully connected layers, followed by a layer with 512 units and Relu activation, and a single-unit dense layer with 'sigmoid' activation. This architecture is commonly used for binary classification tasks. Second, configure the optimizer. Computes the loss, using cross-entropy loss in this case. A list that contains metrics for evaluating this model's performance during testing and training. This is usually s cross-entropy loss between the predicted class probabilities and the true classes. The formula for binary cross-entropy loss for a single example is:
\( Loss classification=-(y*log{(p)}+(1-y)*log(1-p)) \) (1)
where y is the true label (0 or 1). p is the predicted probability of the class being 1. Third, image format conversion. All images (1,000 in total) are resized to dimensions of 150x150. Data is transformed into floating-point tensors for uploading to the network. The next is to normalize and resize images from the specified training and validation directories, and then creates iterators that return batches of processed images and their binary labels for use in training and validation, respectively. The output is found 1000 images belonging to 2 classes. Forth, training the model. Training the model is like teaching a computer to recognize cats and dogs using many pictures. The model takes in images and their labels. As the model sees more images, it tries to guess if it's a cat or dog. At first, it might be wrong often, but it learns from mistakes. The model checks its errors using the loss function and tries to improve. Then, the model is trained through multiple eras and displayed the rotation of all images. Checking the accuracy of the model with a new image after each epoch. Fifth, visualize the results. After training, it's crucial to see model's performance visually. To illustrate accuracy, author creates a chart with two lines: one for "dog" and the other for "cat". This visual effect can quickly understand the efficiency of the model. Some sample images can also be displayed, highlighting the model's predictions next to the actual labels. This visualization not only clarifies performance, but also presents the impressive functionality of the model in a clear and concise manner. The sample of final outcome is shown in the Figure 1.
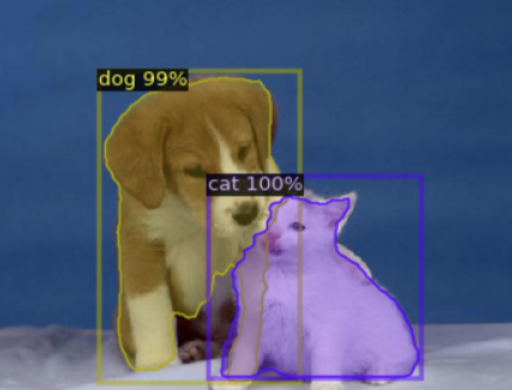
Figure 1. Dog and cat recognition ratio.
3. Result and discussion
3.1. Experimental results
The curves of model loss and accuracy can be observed as shown in the Figure 2. As revealed by the loss curve, with the increase in training epochs, the model's loss gradually decreases, indicating that the model progressively adapts to the training data. Concurrently, the accuracy curve rises, signifying a step-by-step enhancement in the model's predictive performance. It is noteworthy that, after certain epochs, there might be minor fluctuations or a plateau in accuracy. This could be attributed to potential overfitting of the model or improperly set learning rates. On the whole, these two curves offer an intuitive insight into the model's training process, aiding in the evaluation of its performance and determining if further adjustments are necessary.
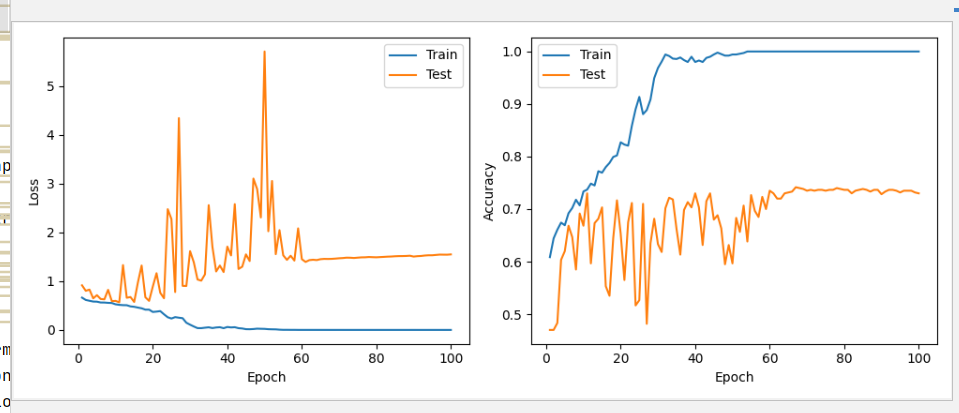
Figure 2. Loss and accuracy curve.
The figure displays the confusion matrix for the model's classification task on cats and dogs. As shown in the Figure 3, the vertical axis represents the true labels, while the horizontal axis stands for the predicted labels by the model. The diagonal elements of the matrix reveal the quantity of correctly classified instances by the model. For instance, the value in the top-left corner represents the number of cats accurately predicted by the model, while the bottom-right value signifies the number of dogs correctly predicted. Off-diagonal elements of the confusion matrix indicate misclassifications by the model. The bottom-left value shows the count of instances that are actually cats but are mispredicted as dogs by the model, and the top-right value represents those that are actually dogs but were erroneously predicted as cats. Additionally, the figure provides a classification report regarding the model's performance, which includes metrics such as the F1 score, recall, accuracy, and precision. These indicators furnish a detailed performance evaluation of the model across different categories, aiding in a more comprehensive understanding of the model's strengths and weaknesses.
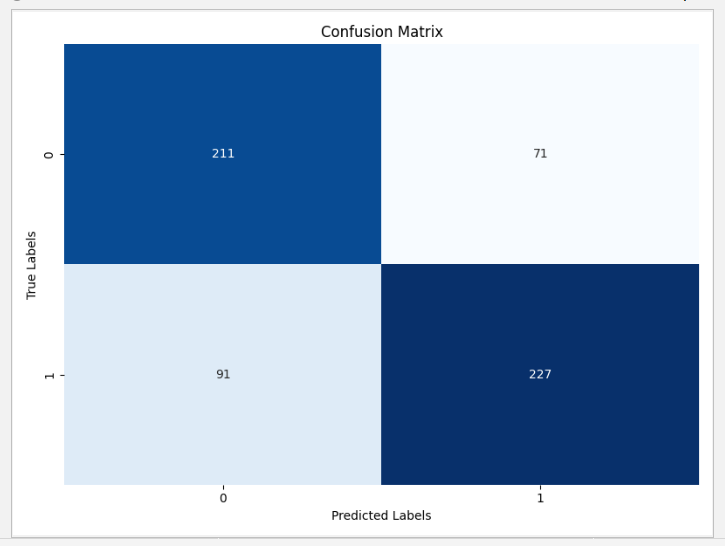
Figure 3. Confusion matrix.
In the classification task of cats and dogs, the confusion matrix provides an intuitive overview of the model's predictions. As shown in the Table 1, values on the diagonal indicate the correct classification count for both the cat and dog categories, while values off the diagonal reveal instances of misclassification. The classification report further elaborates on the model's performance. The accuracy metric presents the overall proportion of correct classifications, whereas precision and recall offer detailed evaluations for each category. Specifically, precision elucidates the accuracy of the model when predicting a particular category, while recall demonstrates the model's capability to identify true positive instances. The F1 score, being the harmonic mean of precision and recall, furnishes a comprehensive assessment criterion. Through these metrics, a deeper understanding of the performance of the model across different categories could be gained, pinpointing potential weaknesses and areas for improvement.
Table 1. Data classification report.
Cat | 0.70 | 0.75 | 0.72 | 282 |
Dog | 0.76 | 0.71 | 0.74 | 318 |
Accuracy | 0.74 | 600 | ||
Macro average | 0.73 | 0.73 | 0.74 | 600 |
Weighted average | 0.73 | 0.73 | 0.74 | 600 |
3.2. Discussion of results
Detectron2 showcases a strong ability to detect individual targets with high precision, generating accurate bounding boxes to pinpoint targets like cats. In tests, when a cat is present, the system displays a high detection probability of 0.9 for the cat and minimal probabilities for dogs and cars. However, the presence of these low probabilities for other objects highlights potential uncertainties in deep learning models. While they are minute, these figures indicate a need for caution in practical applications, suggesting adjustments or higher thresholds to minimize false detections. For images with multiple targets, Detectron2 excels due to its design for multi-object detection. It creates individual boxes for each target, assigning a category label and probability. For instance, in an image with both a cat and a dog, Detectron2 assigns separate, high-probability labels for each. This capability ensures efficiency in applications like automatic feeding systems, allowing decisions based on the detected animal. The system's success stems from its vast training data, emphasizing the importance of continuous data updates for enduring accuracy. While Detectron2 effectively identifies stray animals, it still requires refinements for practical applications and ongoing data collection for lasting effectiveness.
4. Conclusion
With the progress of urbanization, the issue of stray cats and dogs on the streets has become increasingly prominent. To address this, adopted a deep learning framework based on Detectron2 and designed an automatic feeding system aimed at accurately identifying and meeting the dietary needs of these animals. Test results show that the system exhibits high accuracy when identifying single targets. When faced with multi-target images, Detectron2 can independently recognize and label each target, thereby providing appropriate food for each animal. For future work, it can make improvements in model robustness against adversarial attacks and occlusions. Integration with semi-supervised learning could utilize vast unlabeled data, enhancing generalization. Incorporating temporal information may lead to effective distinction between similar dynamic behaviors of cats and dogs.