


1. Introduction
As the impacts of global climate change become increasingly apparent, the frequency and intensity of extreme weather events such as typhoons have risen, and the high-risk character of these disasters has drawn strong attention from governments and the academic community [1]. The body of literature on typhoon-related topics has grown year by year, and research methods and scopes have become increasingly diverse and wide-ranging [2–5]. Typhoon disaster emergency management can prevent and mitigate the impacts and harms caused by typhoons, enabling society to rapidly restore order and promoting harmonious development at the societal level [6]. Current scholarly research on typhoon disaster emergency management tends to concentrate on the following areas: First, typhoon disaster risk prediction and assessment. For example, some studies apply satellite remote sensing and related technologies to conduct disaster risk assessments [7–8], while others use data integration or intelligent models to predict and evaluate the risk of typhoon occurrence and its potential impacts [9–11]. Second, disaster-chain analysis. Typhoons frequently trigger a series of secondary disasters such as heavy rainfall, floods, landslides, and building collapses. Scientifically identifying disaster chains and the systemic risks they induce is of key importance for improving emergency response capability. Existing disaster-chain-oriented studies have mainly focused on urban disaster mitigation capacity assessment [12], analyses of multi-hazard cascading effects [13], and the optimal allocation of emergency resources [14]. Third, information sharing and collaborative cooperation. This research strand emphasizes strengthening information-sharing and coordinated linkage mechanisms among different organizations to improve the accuracy and timeliness of emergency decision-making. For instance, Gu Xiang et al. argue that, under certain objective endowments, information sharing can enhance the effectiveness of meteorological disaster emergency linkage mechanisms [15]; Guo Yanqiang et al. contend that government emergency management organizations serve as bridging and bonding forms of social capital within collaboration networks [16]. Lin Shuting et al., taking Typhoon Hato as an example, revealed the cross-departmental transmission mechanism by which typhoon impacts propagate through Guangdong Province’s industrial chain [17]. Effective linkage and organizational collaboration among government departments are essential for reducing disaster risk, lessening disaster losses, and safeguarding people’s lives and property [18–20]. As a cutting-edge approach in emergency management, social network analysis is often combined with big-data analytics and machine learning to more accurately identify key information, stakeholders, and team compositions [21–23]. Therefore, this paper attempts to apply social network analysis methods to the planned network structures formed within government emergency systems prior to a typhoon’s arrival, and to propose operationally feasible and generalizable collaborative response strategies for typhoon disasters.
2. Materials and methods
2.1. Case selection
On the morning of July 28, 2023, Typhoon Doksuri made landfall in Jinjiang, Fujian Province. Meteorological observations showed that some areas in eastern Fujian and eastern Zhejiang experienced strong winds of force 8–10, and localized areas may have experienced even stronger gusts. The hazards brought by Typhoon Doksuri included damaged and collapsed houses, casualties and people trapped, interruptions to water and power supplies for residents, and varying degrees of damage to crops. It also caused extreme heavy rainfall in North China, triggering severe floods and rainstorms. According to statistics, the disaster affected more than five million people in North China, caused serious damage to housing, and resulted in substantial economic losses.[24] Typhoon Doksuri also impacted northeastern China and induced flooding there, producing direct economic losses exceeding RMB 20 billion. Given the typhoon’s widespread impacts and substantial losses, this study selects it as the case for conducting a social-network analysis. By closely examining the social-network dynamics during the typhoon disaster, the study aims to reveal mechanisms of information diffusion, resource allocation, and social coordination in the disaster response process, thereby providing scientific evidence to improve emergency management efficiency and enhance social resilience.
2.2. Data sources
The data for this study were primarily collected from online sources and include: official government websites and documents — that is, publicly available information and reports on emergency prevention and control for Typhoon Doksuri published on national and provincial/municipal government websites. These data cover documents released via e-government platforms, required response measures, and other related official materials, providing policy background and detailed records of official responses. Media-platform data were also collected, including reports from local news outlets and official local-media Weibo accounts. Because media data are relatively large and heterogeneous, we used the Scrapy web-scraping framework in Python to harvest the data. Scrapy is an efficient and flexible web-scraping framework capable of handling large-scale web requests and data-processing tasks. The crawler collected news items related to “Doksuri” from the websites above, extracting key fields such as each article’s title, publication date, source, and full text. In this way we ensured data completeness and timeliness and established an online dataset for analysis.
2.3. Research methods
This study employs Social Network Analysis (SNA) to quantify organizational collaboration and information transmission among government departments during typhoon emergency response and to construct a social-network model. The specific steps are as follows:
2.3.1. Data collection and quantification
Collect quantitative indicators reflecting organizational collaboration and information transmission among government departments during the Typhoon Doksuri emergency response. These data include inter-departmental communication frequency, content of information sharing, task assignment for collaboration, and so on, providing the basic data needed to build the social network.
2.3.2. Social-network construction
Using SNA tools UCINET and Gephi, construct a social-network model based on the collected quantitative data. UCINET is used for preliminary data processing and generation of network matrices, while Gephi is used for network visualization and further structural analysis.
2.3.3. Network structural analysis
Apply metrics such as emergency-network structure measures, node centrality (Node Centrality), and core–periphery analysis (Core–Periphery Analysis) to analyze the network structure. Specifically:
2.3.4. Network structure
Analyze overall structural characteristics of the network — for example, network density and clustering coefficient — to assess the degree of connectivity among departments and the efficiency of information transmission.
2.3.5. Node centrality
Identify key nodes in the network — i.e., organizational departments that play central roles in emergency response — using Degree Centrality, Closeness Centrality, and Betweenness Centrality.
2.3.6. Core–periphery analysis
Identify core and peripheral organizations within the network, analyze their roles in emergency response, and examine interactions between core and peripheral organizations.
2.3.7. Organizational-relationship analysis
Conduct an in-depth analysis of the participating government departments and working groups involved in typhoon emergency defense to reveal the relational structure among organizations. By analyzing these relationships, explore how they influence disaster-response effectiveness and provide a theoretical basis for organizational coordination and cooperation.
Through the methods described above, this study aims to comprehensively reveal the relational structure among organizations participating in emergency linkage and how these relationships affect disaster response outcomes, thereby offering scientific guidance to improve emergency response efficiency and optimize organizational coordination mechanisms.
3. Results and analysis
3.1. Network group construction
The grouping in this study is mainly based on government documents issued by provincial and municipal governments regarding typhoon response. Among them, the Notice of the General Office of the Jiangsu Provincial Government on Printing and Distributing the Jiangsu Province Typhoon Emergency Response Plan (2024) [25], the Notice of the General Office of the Nantong Municipal Government on Printing and Distributing the Nantong City Typhoon Emergency Response Plan (2024) [26], and the Notice of the General Office of the Xiamen Municipal People’s Government on Printing and Distributing the Flood and Typhoon Emergency Response Plan (2023) [27] provide relatively comprehensive information. Therefore, this study mainly refers to these three documents. From these notices, the designated task forces and their responsibilities were extracted to provide the data foundation for subsequent analysis of the planned network structure. This study focuses on the network structure formed by the departments and task forces engaged in defense and prevention against Typhoon Doksuri, which are organized into ten task forces. Each task force has defined responsibilities and a lead department (including the Office, General Coordination Group, etc., as shown in Table 1).
|
Task Force |
Responsibilities |
Lead Department and Members |
|
Office |
Responsible for overall command and coordination during emergency response. |
Lead: Municipal Government. Members: Municipal Flood Control Office, mainly in charge of emergency work arrangements. |
|
General Coordination Group |
Monitor typhoon dynamics, forecast and issue warnings for typhoons and related natural disasters. Coordinate and chair meetings, improve disaster inspection data collection, and report in a timely manner as required. |
Lead: Municipal Flood Control Office. Members: Water Resources Bureau, Emergency Management Bureau, Meteorological Bureau, Agriculture and Rural Affairs Bureau, etc. |
|
Work Guidance Group |
Provide on-site guidance in disaster-stricken areas, mainly responsible for directing ships into ports for shelter. Organize evacuation of key and vulnerable populations, prepare rescue teams and relief materials, and promptly report relevant information to the Municipal Flood Control Office. |
Lead: Municipal Flood Control Office. Members: To be specified by documents issued by the Municipal Flood Control Headquarters. |
|
Rescue and Relief Group |
Develop rescue plans based on risks, deploy emergency rescue operations, and allocate relief funds. Coordinate and conduct emergency rescue in major disasters, mobilizing armed forces, armed police, fire brigades, and social rescue teams. Responsible for epidemic prevention and medical relief in disaster areas. |
Lead: Emergency Management Bureau. Members: Public Security Bureau, Finance Bureau, Transport Bureau, Water Resources Bureau, Fire and Rescue Detachment, etc. |
|
Publicity and Reporting Group |
Coordinate and guide media coverage. Release and publicize typhoon prevention and rescue information. Hold press conferences when necessary and monitor public opinion. Promote self-help and mutual aid knowledge among the public, and issue typhoon warnings and safety reminders. |
Lead: Municipal Publicity Department. Members: Water Resources Bureau, Emergency Management Bureau, Culture, Radio, Television and Tourism Bureau, Communications Administration, etc. |
|
Security and Alert Group |
Control road traffic and implement urban defense measures as required by the local command. During disasters, organize transportation of affected populations and rescue vehicles. Issue alerts in key defense zones and maintain public order. |
Lead: Public Security Bureau. Members: Transport Bureau, etc. |
|
Expert Technical Group |
Provide technical support for typhoon command decisions and emergency response. |
Lead: Emergency Management Bureau. Members: Experts from relevant units, scientific research institutions, and design organizations, depending on industry and expertise. |
|
Logistics Support Group |
Coordinate the transport of emergency supplies, ensure the livelihood of affected populations, and secure critical sectors such as electricity, communications, and transportation. |
Lead: Development and Reform Commission. Members: Finance Bureau, Transport Bureau, Industry and Information Technology Bureau, Communications Administration, etc. |
|
Inspection and Supervision Group |
Responsible for supervising and inspecting typhoon prevention work. Issue supervision reports as appropriate, urge rectification of violations, and, where necessary, pursue accountability. |
Lead: Municipal Flood Control Office. Members: Emergency Management Bureau, Water Resources Bureau, Industry and Information Technology Bureau, Agriculture and Rural Affairs Bureau, Maritime Bureau, etc. |
|
Evacuation and Resettlement Group |
Organize and guide the evacuation and resettlement of disaster-affected populations, ensure basic living conditions, provide consolation for victims’ families, and allocate relief funds and materials. |
Lead: Water Resources Bureau, Emergency Management Bureau, Agriculture and Rural Affairs Bureau. Members: Development and Reform Commission, Education Bureau, Industry and Information Technology Bureau, Public Security Bureau, Finance Bureau, etc. |
3.2. Network structure analysis
Based on the analysis of the actual participation of government departments in responding to the typhoon disaster, an empirical study was conducted on the relationships among actors in the network and how these interconnections influence the overall characteristics of the network. The social network for meteorological disaster emergency coordination consists of 44 government departments and 10 task forces. Using UCINET’s NetDraw and Gephi visualization software, the collaborative network structure of typhoon disaster defense was constructed.
3.2.1. Overall network topology
As shown in Fig. 1, each governmental department is represented by a green circular node. The maximum node size is set to 50 and the minimum to 20, with each edge indicating the degree of connection within the planned network. Darker colors and larger node sizes represent task forces with broader departmental participation, while lighter colors and smaller node sizes indicate the opposite. It can be observed that the Inspection Task Force, Comprehensive Task Force, Relocation and Resettlement Task Force, and Emergency Rescue Task Force involve the largest number of participating departments and are positioned near the center of the network, functioning as the core groups. By contrast, the Security and Alert Task Force has the fewest participants and is located at the network’s periphery.
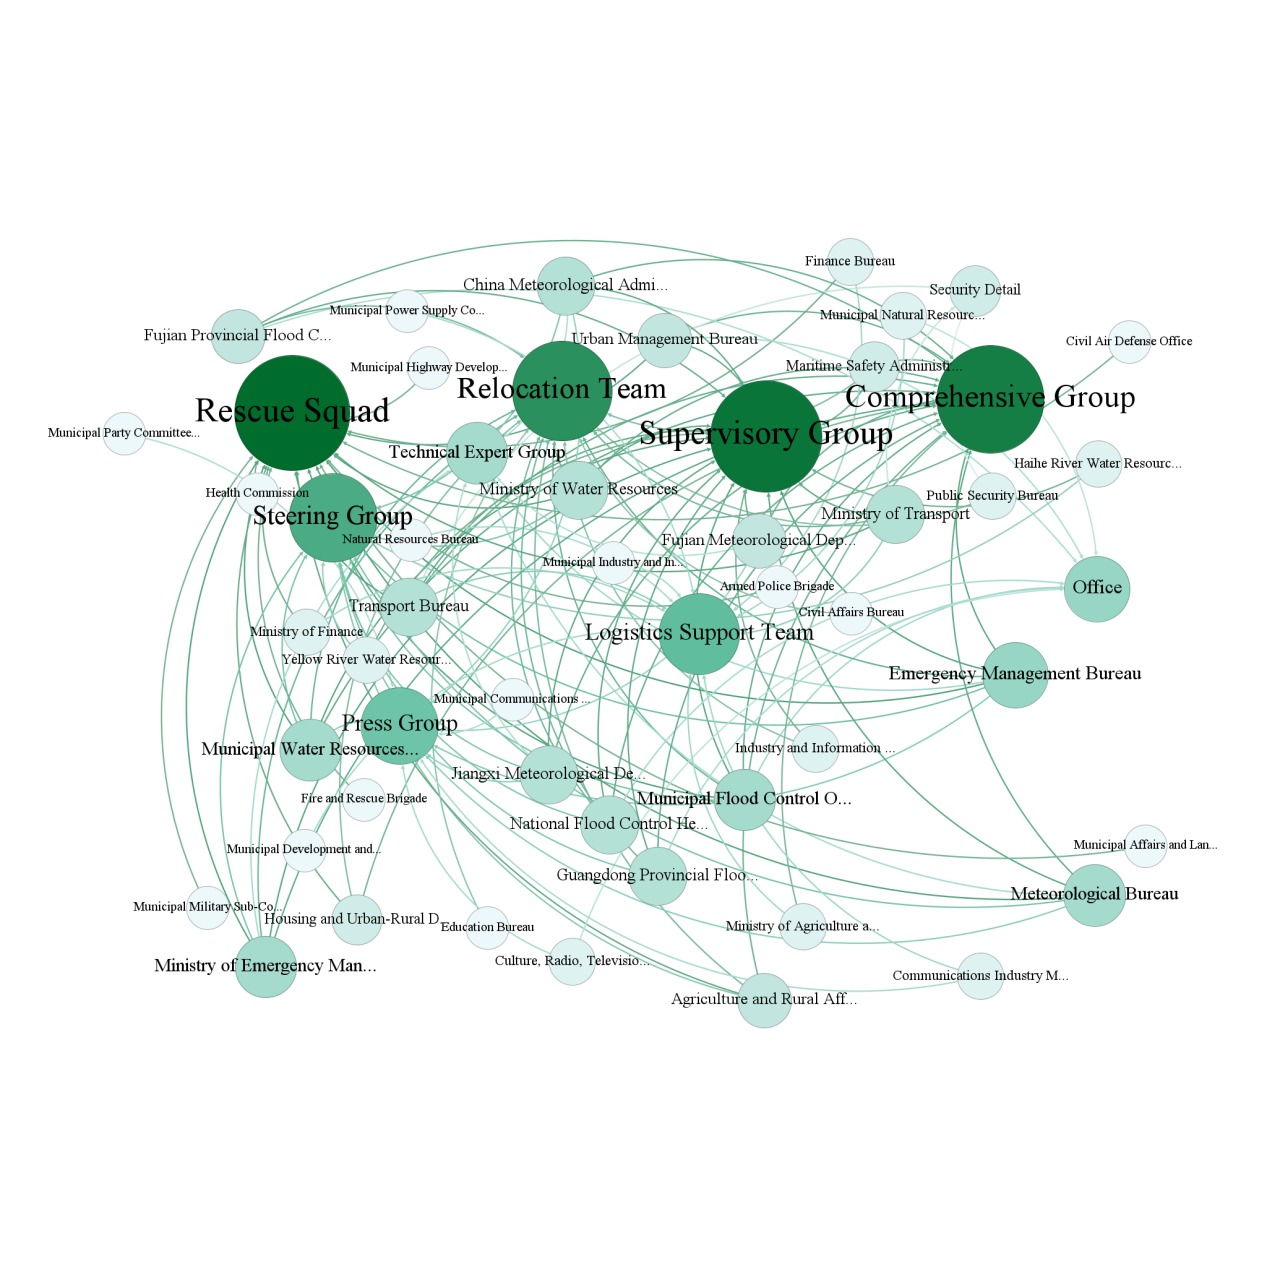
This suggests that the Inspection and Comprehensive task forces play critical roles in supervising and coordinating the departments responsible for typhoon emergency response. Prior to the landfall of the typhoon, the primary tasks are to relocate residents and resources from high-risk areas, ensure the basic livelihoods of affected populations, and then dispatch rescue forces for on-site operations, including medical treatment and resettlement of victims. The figure also shows that the Security and Alert Task Force has an in-degree of only three, meaning only three departments are involved. Since this task force is mainly responsible for traffic control, evacuation of rescue teams and vehicles, and maintaining public order in key defense areas, it is positioned on the periphery. It is recommended that the role of the Security and Alert Task Force be strengthened in future contingency plans, as this would enhance rescue efficiency, reduce casualties in high-risk areas, and mitigate subsequent economic losses.
3.2.2. Node centrality analysis
To identify the core organizations within the planned network, centrality was calculated using UCINET. Before the computation, the two-mode matrix was converted into a one-mode matrix. In addition to the column-mode matrices of task forces presented earlier, the row-mode matrices of departments were derived for analysis. The top ten organizational actors are shown in Table 2. As illustrated in Table 2, the Ministry of Emergency Management, Emergency Management Bureau, Ministry of Water Resources, Municipal Water Resources Bureau, Municipal Flood Control Office, Fujian Provincial Flood Control Headquarters, and the National Flood Control and Drought Relief Headquarters exhibit the highest degree, closeness, and betweenness centralities. This indicates that emergency management, water resources, and flood control agencies are indisputably the core organizations of the network.
|
Organizational Department |
Degree Centrality |
Closeness Centrality |
Betweenness Centrality |
|
Ministry of Emergency Management |
90.000 |
86.000 |
24.629 |
|
Emergency Management Bureau |
87.000 |
91.489 |
43.134 |
|
Ministry of Water Resources |
86.000 |
86.000 |
24.629 |
|
Municipal Water Resources Bureau |
83.000 |
91.489 |
43.134 |
|
Municipal Flood Control Office |
75.000 |
75.439 |
12.309 |
|
Fujian Provincial Flood Control HQ |
75.000 |
75.439 |
12.309 |
|
National Flood Control HQ |
75.000 |
75.439 |
12.309 |
|
Guangdong Provincial Flood Control HQ |
75.000 |
75.439 |
12.309 |
|
Maritime Bureau |
74.000 |
86.000 |
24.629 |
|
Ministry of Transport |
66.000 |
89.583 |
44.072 |
Similarly, Table 3 presents the centrality results of the task forces. The Inspection Task Force, Comprehensive Task Force, and Relocation and Resettlement Task Force rank the highest in centrality. Among them, the Inspection Task Force has the highest closeness and betweenness centrality, making it the most central task force. By contrast, the Security and Alert Task Force ranks the lowest in all three measures, indicating its marginal position within the planned network. This outcome is reasonable since the data used in this study are primarily drawn from pre-disaster contingency plans, where security and traffic control measures play a more significant role during and after the disaster rather than in pre-event planning. In contrast, the Comprehensive and Inspection task forces are most crucial at the planning stage: the Comprehensive Task Force coordinates overall operations, convenes meetings, and manages disaster information collection and reporting, while the Inspection Task Force supervises and evaluates preparedness, issues inspection reports, and ensures accountability.
|
Task Force |
Degree Centrality |
Closeness Centrality |
Betweenness Centrality |
|
Inspection Task Force |
71.000 |
100.000 |
2.750 |
|
Comprehensive Task Force |
59.000 |
90.000 |
1.167 |
|
Relocation and Resettlement Task Force |
58.000 |
100.000 |
2.750 |
|
Work Guidance Task Force |
46.000 |
90.000 |
1.167 |
|
Emergency Rescue Task Force |
33.000 |
90.000 |
1.250 |
|
Publicity and Reporting Task Force |
24.000 |
81.818 |
0.167 |
|
Expert and Technical Task Force |
20.000 |
75.000 |
0.000 |
|
Logistics Support Task Force |
17.000 |
81.818 |
0.750 |
|
Office |
16.000 |
64.286 |
0.000 |
|
Security and Alert Task Force |
10.000 |
64.286 |
0.000 |
The government places greater emphasis on supervision and guidance in typhoon defense during emergency rescue operations, in order to better implement rescue measures and ensure public safety. The Security and Alert Task Force is mainly responsible for road traffic control, directing disaster relief personnel and vehicles, implementing security alerts in key defense areas, and maintaining public order. Its primary work is carried out under conditions where typhoons have caused severe road blockages and casualties, including setting up alert lines in defense zones and stabilizing road order. Therefore, this task force involves fewer cooperating departments. After a typhoon strikes, the government should prioritize the relocation and resettlement of affected residents to ensure their basic living needs are met. Consequently, the Relocation and Resettlement Task Force includes a larger number of participating government departments and occupies a core position in the planned network of workgroups.
3.2.3. Collaboration analysis of core departments
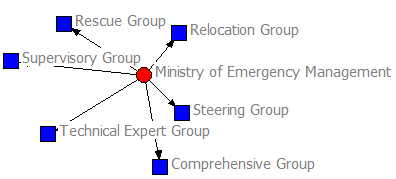
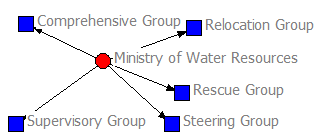
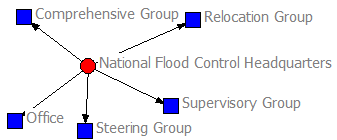
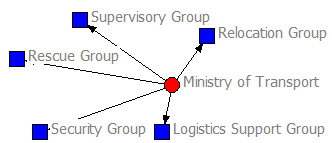
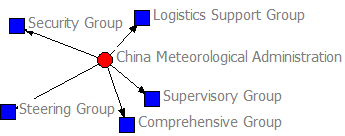
According to the collected data, the core departments involved in the emergency response to Typhoon “Doksuri” include emergency management agencies at all levels, water resources departments, flood control and drought relief headquarters, the Ministry of Transport, and the China Meteorological Administration, totaling 11 key departments. Among them, five representative departments with the highest degree centrality (e.g., the Ministry of Emergency Management, the Ministry of Water Resources) were selected for collaboration network visualization, as shown in Fig. 2.
|
|
|
|
|
|
Figure 2. Collaboration networks of core departments
Within the planned network, the Ministry of Emergency Management participates in six task forces, indicating that it is the most important and central department in typhoon defense and rescue operations. Fig. 2 illustrates the collaborative networks of the five main core departments. Among them, the Ministry of Emergency Management and the National Flood Control Headquarters serve as lead agencies, reflecting their central and decisive roles in the planned network. Other core organizations, such as the Ministry of Transport, the China Meteorological Administration, and the Ministry of Water Resources, also play significant roles, each engaging in five task forces.
3.2.4. Matrix model verification
When conducting network analysis with UCINET, the two-mode data must first be transformed into one-mode data. The resulting matrix relationships are shown in Table 4, which indicates the number of shared departments between task forces.
From the lower triangle of Table 4, it can be observed that the Inspection Task Force and the Comprehensive Task Force share the largest number of departments (17). This is followed by the Inspection Task Force and the Relocation and Resettlement Task Force, which share 15 departments. Other task force pairs have fewer common departments.
The diagonal values in Table 4 represent the total number of departments engaged in each task force. The Inspection Task Force has the largest number of participating departments (22), followed by the Comprehensive Task Force and the Relocation and Resettlement Task Force, each with 20 departments. The Security and Alert Task Force has the fewest, with only three departments. The results highlight the strong interconnections among the Inspection, Relocation and Resettlement, and Comprehensive task forces, as many of the same departments are responsible for oversight, resettlement, and coordination functions. All participating organizations prioritize the safety and livelihoods of the public, focusing on evacuation, resettlement, and supervision of relevant departments and task forces. In contrast, the Security and Alert Task Force shows limited connections, with stronger associations only with three groups, including the Emergency Rescue Task Force. This suggests that its responsibilities—mainly traffic control, rescue route management, and order maintenance—are relatively independent from the functions of other task forces.
|
Workgroup |
Office |
Comprehensive Task Force |
Work Guidance Task Force |
Emergency Rescue Task Force |
Relocation and Resettlement Task Force |
Publicity and Reporting Task Force |
Security and Alert Task Force |
Expert and Technical Task Force |
Logistics Support Task Force |
Inspection Task Force |
|
Office |
5 |
4 |
4 |
0 |
4 |
0 |
0 |
0 |
0 |
4 |
|
Comprehensive Task Force |
4 |
20 |
11 |
5 |
13 |
4 |
0 |
3 |
2 |
17 |
|
Work Guidance Task Force |
4 |
11 |
13 |
2 |
7 |
4 |
0 |
4 |
2 |
12 |
|
Emergency Rescue Task Force |
0 |
5 |
2 |
16 |
8 |
2 |
3 |
2 |
4 |
7 |
|
Relocation and Resettlement Task Force |
4 |
13 |
7 |
8 |
20 |
3 |
3 |
2 |
3 |
15 |
|
Publicity and Reporting Task Force |
0 |
4 |
4 |
2 |
3 |
10 |
0 |
4 |
1 |
6 |
|
Security and Alert Task Force |
0 |
0 |
0 |
3 |
3 |
0 |
3 |
0 |
2 |
2 |
|
Expert and Technical Task Force |
0 |
3 |
4 |
2 |
2 |
4 |
0 |
5 |
0 |
5 |
|
Logistics Support Task Force |
0 |
2 |
2 |
4 |
3 |
1 |
2 |
0 |
10 |
3 |
|
Inspection Task Force |
4 |
17 |
12 |
7 |
15 |
6 |
2 |
5 |
3 |
22 |
3.2.5. Core–periphery analysis
To further investigate the relationships among nodes, the core–periphery model was applied, which helps distinguish closely connected core areas from relatively loosely connected peripheral areas within the network. The analysis results show a core score of 5.429 and a periphery score of 2.000, indicating a significant difference between core and peripheral groups.
As shown in Table 5, eight task forces—including the Office, Comprehensive Task Force, Work Guidance Task Force, Emergency Rescue Task Force, Relocation and Resettlement Task Force, Publicity and Reporting Task Force, Expert and Technical Task Force, and Inspection Task Force—are located in the core area. By contrast, the Security and Alert Task Force and the Logistics Support Task Force fall into the periphery area, reflecting their relatively limited interactions with other groups.
|
Category |
Task Forces |
|
Core groups |
Office, Comprehensive Task Force, Work Guidance Task Force, Emergency Rescue Task Force, Relocation and Resettlement Task Force, Publicity and Reporting Task Force, Expert and Technical Task Force, Inspection Task Force |
|
Peripheral groups |
Security and Alert Task Force, Logistics Support Task Force |
This distribution suggests that most task forces play central roles in disaster preparedness and emergency response. During typhoon emergencies, the government first establishes the Comprehensive and Work Guidance Task Forces to provide leadership and coordination. Subsequently, the Relocation and Resettlement Task Force ensures the timely evacuation and accommodation of affected residents, while the Emergency Rescue Task Force focuses on life-saving operations and infrastructure restoration. Meanwhile, the Publicity and Reporting Task Force disseminates information, and the Expert and Technical Task Force supports scientific forecasting and decision-making. After severe flooding caused by the typhoon, the Inspection Task Force supervises site clearance and maintains order. Collectively, these core task forces form the backbone of the government’s emergency management network.
4. Conclusion and discussion
Drawing on the perspective of social network analysis and building upon previous studies, this research takes Typhoon Doksuri as a case to construct an emergency collaborative governance network for intergovernmental cooperation in disaster defense. The main findings are as follows:
(1) Key nodes dominate emergency effectiveness: The Ministry of Emergency Management (centrality 90.000), Water Resources Department (centrality 86.000), and Flood Control and Drought Relief Headquarters (centrality 75.000) serve as core hubs. With high betweenness centrality values (24.629–43.134), these actors control the circulation of resources. However, matrix analysis reveals that departmental collaboration forms a “Supervision–Comprehensive–Resettlement” triangular cluster (departments jointly involved ≥15), while inter-group coordination remains weak (e.g., the Security and Vigilance Group is linked to only three departments).
(2) The collaboration network shows clear hierarchical differentiation: Functional divisions among participating departments are distinct. The Supervision Group (centrality 71.000), Comprehensive Group (centrality 59.000), and Relocation and Resettlement Group (centrality 58.000) form the core hubs, assuming cross-departmental coordination and oversight functions. In contrast, the Security and Vigilance Group (centrality 10.000) and Logistics Support Group (centrality 17.000) are marginalized due to role misalignment in pre-disaster contingency plans. Matrix analysis further shows that the “Supervision Group” connects with most government departments, which aptly illustrates the supervisory function of government in meteorological disaster prevention and mitigation.
(3) Structural weaknesses heighten response risks: The emergency collaboration network displays a distinct core–periphery structure, which creates two types of vulnerabilities. First, in the pre-disaster stage, the marginalization of the Security and Vigilance Group weakens traffic control and order maintenance, potentially delaying the golden rescue window. Second, during disaster response, the low embeddedness of the Logistics Support Group (matrix correlations ≤2) constrains the efficiency of material allocation, thereby aggravating secondary disaster losses. Hence, peripheral groups and departments should actively engage in typhoon defense and response.
Based on these findings, and from the perspective of social network analysis, both the overall network structure and node-specific roles offer guidance for improving network resilience and efficiency. Accordingly, this study proposes the following feasible optimization strategies for typhoon emergency collaboration: Optimize the linkage mechanism of government emergency networks: Establish a “functional bundling” system that mandates core departments (e.g., Supervision Group) to incorporate peripheral ones (e.g., Security and Vigilance Group) into decision-making, thereby breaking structural holes through shared responsibility. Strengthen interdepartmental coordination capacity: Develop a digital-twin emergency simulation platform based on social network models to replicate chain-disaster scenarios triggered by typhoons, thereby training departmental nodes to coordinate effectively under resource constraints. Build a long-term safeguard system for meteorological disaster emergency networks: Construct a cross-domain “meteorology–transportation–livelihood” data lake to enable disaster information to penetrate peripheral nodes in real time, enhancing both the capacity and efficiency of typhoon disaster response.
Funding project
This work was jointly supported by the Ministry of Education's Humanities and Social Sciences Project (29YJC630133) and the National Natural Science Foundation of China (42077209).