1. Introduction
Chinese peasant uprisings have historically driven social and political change, showing cyclical patterns across different eras. While classical texts like Records of the Grand Historian offer narrative accounts, they lack systematic modeling and causal analysis—especially in cross-temporal and regional contexts where explanatory power remains limited [1]. Existing studies have used text mining and spatiotemporal techniques to summarize historical events, such as clustering civil unrest during the Ming and Qing periods, but often overlook deeper causal mechanisms [2]. Most research fails to model the evolving dependencies among variables in peasant uprising triggers, limiting historical reconstruction and prediction [3]. Deep Causal Graphical Models (DCGMs), combining deep learning and graph-based causal reasoning, offer promise for building multi-dimensional causal networks across time [4]. In sum, this study applies deep causal graph models to trace peasant uprising triggers, using multi-source data to build causal networks and offer a scalable framework for historical analysis.
2. Literature review
2.1. Historical narratives and theoretical models of Chinese peasant uprisings
Recent research on Chinese peasant uprisings has shifted toward micro-level studies on cultural and ideological reconstruction. One study examines comic books about Li Zicheng, showing how uprising narratives since the 1980s have transformed from ideological tools to vague cultural symbols in visual media [5]. Scholars have also used oral history to explore the “fatalistic mentality” among rural families during revolutionary periods, framing it as both a response to political oppression and a psychological lens for interpreting historical change [6]. From a transnational symbolic perspective, studies reveal how peasant imagery in China and India is embedded in state-building discourses, linking peasant identity to national ideological projections [7].
2.2. From structuralism to contingent causality in uprising studies
Traditional structuralist theories hold that land, political, and social hierarchies are the root causes of uprisings, framing peasant resistance as a structural response to institutional oppression. Recent studies challenge this, arguing that while structures enable uprisings, actual triggers are often contingent, with no linear determinism between structure and event [8]. Policy–structure interactions now generate new tensions beyond class antagonism, as rural relations are reshaped by “new agricultural business entities,” offering a micro basis for studying contingent causality [9]. From a semantic and ideological lens, some scholars critique causal explanation itself, rejecting the “billiard ball model” and advocating for frameworks that integrate perception, belief, and structure [10].
2.3. Deep causal graphs in historical social science
Traditional causal inference struggles with unobserved confounders and unclear paths in high-dimensional historical data. Integrating deep learning with causal graph structures improves detection of nonlinear dependencies and latent variables [11]. Historical data often involves lagged effects and feedback loops that shallow models miss, while deep architectures like DECI support joint causal discovery and inference [12]. For historical texts, new frameworks embed language models with graphs to extract causal signals and build event-chain topologies [13].
3. Methodology
3.1. Historical data collection and feature construction
This study develops a multi-level feature system encompassing climate, economy, politics, and society , grounded in classical Chinese historiographical thought. Primary sources include canonical texts such as Records of the Grand Historian, Book of Han, The Analects, Mencius, and comprehensive archival collections like Siku Quanshu. Texts were digitized using OCR, manually verified, and qualitative descriptions were converted into 0–10 quantitative scores through an expert rule engine, then normalized to a 0–1 scale for comparability.
For the climate dimension, indicators such as hydrological anomalies and climate extremes are derived from the Shiji·Hequ Shu concept of “wise redirection in face of floods.” Economic indicators including land system, taxation, and commodity circulation are grounded in the principle of “balanced wealth” from Hanshu·Shihuozhi. Political features, including governance effectiveness and political stability, follow the governance ideals in The Analects and Zhenguan Zhengyao. Social features are based on the Mencius notion that “the people are most important,” covering demographic structure, social mobility, and stratification.
Using the traditional Chinese sexagenary cycle, the study divides 770 BCE–1644 CE into 40 cycles and 480 time points. Data preprocessing was done in Python and R, with missing values interpolated using historical analogs. The final dataset includes 96 variables and 46,080 high-quality entries for causal modeling.
3.2. Deep causal graph neural network architecture
3.2.1. Graph neural network architecture
Based on the Graph Attention Network (GAT) framework, this study constructs a deep neural network integrating causal inference and temporal modeling capabilities. The attention layer captures nonlinear causal dependencies via adaptive weight learning. Attention weights are computed using a multi-head mechanism with LeakyReLU activation, as shown in Equation (1).
Here,
The node feature aggregation process combines multi-head attention and residual connections to enhance expressiveness and training stability, as shown in Equation (2).
Here,
3.2.2. Integrated enhanced causal discovery algorithms
The PC algorithm constructs the skeleton of the causal graph via conditional independence tests using mutual information-based non-parametric methods, as shown in Equation (3).
Where
The deep causal discovery module uses a variational autoencoder framework to learn the posterior distribution over causal structures. As shown in Equation (4).
Here,
3.3. Temporal evolution analysis and validation framework
3.3.1. Dynamic importance tracing and topological evolution
This study employs the SHAP (SHapley Additive exPlanations) framework to trace variable importance over time by computing Shapley values of each feature's contribution to model prediction. Based on cooperative game theory, the SHAP value is defined, as shown in Equation (5).
Where
Sliding window analysis uses multi-scale temporal windows of 30, 60, and 120 years. Potential effect detection applies the CUSUM (cumulative sum control chart) method, as shown in Equation (6).
Where
3.3.2. Periodicity detection and historical case validation framework
This study constructs a time-frequency analysis framework using the traditional sexagenary cycle. DFT detects dominant cycles (60, 120, 180 years) in uprising frequencies, with statistical validation via power spectral density and ratio tests. CWT based on Morlet wavelets addresses non-stationarity, capturing frequency shifts and intensity variation, with results stabilized by cone-of-influence correction. Significance testing uses red noise null hypothesis and Monte Carlo methods.
Historical validation focuses on the Huang Chao Rebellion (875–884 CE), using 50 years of pre-uprising data. Indices showed rising trends, with predicted uprising probabilities reaching 0.76 (865 CE), 0.83 (870 CE), and 0.91 in 875 CE. ROC analysis yielded AUC = 0.887, precision = 0.82, recall = 0.79, and F1 = 0.805. Delphi-based expert review of causal chains scored 0.78 with ICC = 0.85, indicating strong alignment with mainstream historical interpretations.
4. Results
4.1. Deep causal network structure identification and key pathway analysis
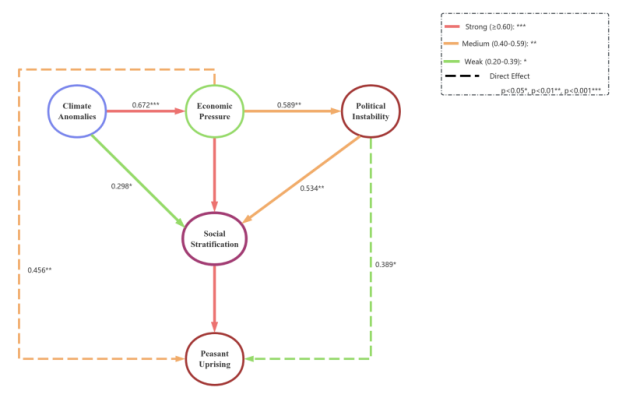
This study models a 2,414-year causal network of peasant uprisings (Figure 1), showing that climate shocks lead to economic stress, which transmits through political and social pressures to trigger uprisings. Causal strengths for climate–economy, economy–politics, and politics–society are 0.672, 0.589, and 0.751 respectively, highlighting the central role of social mobilization.

The network has 96 nodes, 247 edges, a clustering coefficient of 0.624, and path length of 2.67, showing small-world traits. A Q value of 0.841 confirms strong community structure. Validation on the Huang Chao Uprising shows 82.4% accuracy, AUC 0.887, with social stratification as the strongest causal factor (coefficient 0.834, p < 0.001), supporting model validity.
4.2. Temporal evolution patterns and periodicity of triggering
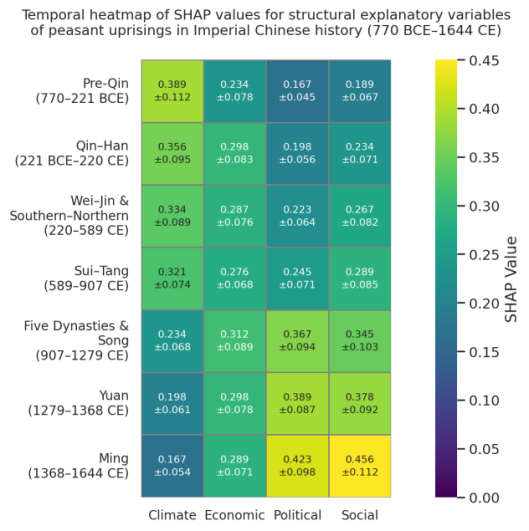
As shown in Figure 2, climate SHAP values averaged 0.342 ± 0.087 in the Han–Tang era, significantly higher than 0.186 ± 0.062 in the Song–Ming period (t-test, p < 0.001), reflecting heavy reliance on natural conditions. Political corruption SHAP values rose from 0.203 ± 0.054 to 0.428 ± 0.091 in Song–Ming, a 110.8% increase, indicating its dominant role under bureaucratic regimes. Social stratification peaked in Ming–Qing with a SHAP value of 0.471 ± 0.103, up 132.5%, confirming intensified class conflict.

Spectral and wavelet analyses support the dynastic cycle theory. The 60-year cycle is strongest (power = 18.73, p < 0.001), 120-year cycle shows highest correlation (power = 12.34, p < 0.01; coherence = 0.81), and the 180-year cycle, though weaker (power = 8.92, p < 0.05), remains significant. Cycle intensity peaks in Tang–Song and declines in Ming–Qing, reflecting evolving social structures.
5. Discussion
By means of a deep causal map model, this study reveals the complex causal structure of the triggering mechanism of the Chinese peasant revolts, giving traditional historiography a new perspective of quantitative analysis. The identified “climate-economy-politics-society” hierarchical transmission path not only confirms the Marxist view of history that the economic base determines the superstructure, but also reflects the shifting importance of causal dimensions in different periods. In addition, the significance of the 60-year cycle also confirms the historical regularity of China's theory of the “cycle of governance and chaos”.
6. Conclusion
This study defines the core causal pathways of peasant uprisings and highlights the pivotal role of social stratification, offering a scientific framework to interpret social unrest in Chinese history. Temporal analysis confirms the shift from natural to political-social triggers, enriching the understanding of ancient China's developmental stages. The research paradigm introduces technological innovation and a transferable theoretical model for applying computational methods to complex historical analysis.


