


1. Introduction
Paragonimiasis is a parasitic disease that is common in underdeveloped tropical regions, especially in Africa and Southeast Asia. Its symptoms include fever, cough, and chest pain with the risk of death when not under appropriate medical treatment [1, 2]. It is estimated that around 21 million people are infected paragonimiasis globally each year, and 293 million people are under the risk of infection [3, 4]. Yet, the field is lacking of study on its prevention and prediction, and not much research on its spreading trend is done. Paragonimus westermani, or oriental lung fluke, is the major source of human infection of paragonimiasis, which can infect multiple animals, and thus has a complicated route of transmission.
The mathematical significance of investigating the pattern of transmission of paragonimiasis comes from its path of infection which is distinct compared to other common diseases. Previous studies have shown that the route of transmission of Paragonimus westermani consists of 3 stages and contains 2 intermediate hosts. In the first stage, the parasites infect snails, which are the first intermediate hosts. After the parasites have developed in snails’ bodies, they infect freshwater crabs and crayfish, which are the second intermediate hosts. Finally, in the third stage, they infect humans and cause paragonimiasis [5-8].
Studies have also shown that although Paragonimus westermani is not contagious between humans, it can be spread through intermediate hosts, meaning that infected snails can infect another snail; infected carbs and crayfish can infect other crabs and crayfish. There are also chances that infected snails can directly cause paragonimiasis in human body [2, 9]. Nevertheless, previous studies only focused on the flow path and the developing process of Paragonimus westermani, with no simulation models to quantitatively represent the pattern of infection. There is also no consideration of the effects of different factors involved in the route of transmission. Factors, such as the infection rate and recovery rate that differs between species have large impacts on the analysis of pattern of transmission. Thus, in this paper, we will model the spreading of paragonimiasis with a variation of SIR model. By constructing a compartmental model including snails, crustaceans (crabs and crayfish) and human, we investigated the spreading and prevalence of Paragonimus westermani-caused paragonimiasis, which includes the consideration of difference in infection rate and recovery rate between hosts and the deduction of disease-free equilibrium of the proposed dynamic system. This essay will also find out the basic reproduction number using the dynamic model established. By analyzing its sensitivity with the parameters related to its transmission, discussion on measures and policies to reduce its impact on humanity will be carried out [10, 11].
2. The model
Consider a compartmental model with the following routes of transmission: (i) horizontal transmission among snails; (ii) horizontal transmission among crustaceans; (iii) vertical transmission from snails to human; (iv) vertical transmission from crustaceans to human.
The following assumptions are made in this model:
(A1) Mortality rate for susceptible population, carrier population, and recovered population is the same, while the infected population has a higher mortality rate.
(A2) The latent period of Paragonimus westermani is negligible.
(A3) The possibility of inverse infection (from human to snails or crustaceans, and from crustaceans to snails) is negligible.
(A4) Birth rate of each species is a constant.
According to the above routes of transmission and assumptions, we divide snails, crustaceans, and humans into the following subgroups: susceptible, infected, carrier (for humans only), and recovered.
Susceptible species are those that have never been infected by Paragonimus westermani and are under the risk of infection. Susceptible population of snails, crustaceans, and humans are denoted by Sa, Sb, and Sc, respectively. As stated by assumption (A4), each susceptible population has a constant birth rate of ba, bb, and bh respectively. The mortality rates for these subgroups are expressed as fractions of total susceptible populations, being μa0, μb0, and μh0, respectively. The only possible increase in any susceptible population is newborn individuals, reflected by birth constants. For any snail in susceptible population, there are 2 ways to leave the susceptible population, either dead or infected by other snails, which makes it part of infected population. For any crustacean in susceptible population, there are 3 ways to leave the susceptible population: (i) dead; (ii) infected by snails and enter infected population; and (iii) infected by other crustaceans and enter infected population. For any human in susceptible population, there are also 3 ways to leave the susceptible population: (i) dead; (ii) infected by snails and enter infected population; and (iii) infected by crustaceans and enter infected population.
The rate of infection is a fraction that reflects the force of infection. Higher the rate of infection, easier the species get infected by Paragonimus westermani. The rate of infection is positively related to both susceptible population and infected population. For snail, crustacean and human susceptible populations, the rate of infections are denoted by βa, βb, and βh, respectively. These infections enter the infected population, which are denoted by Ia, Ib, and Ih respectively. The infected population has a slightly higher mortality rate, denoted by μa1, μb1, and μh1 for snails, crustaceans, and humans respectively. For snails and crustaceans, they each have a natural recovery rate of λa and λb, which are fractions of total infected populations. The recovered populations for snails and crustaceans are denoted as Ra and Rb respectively. As stated in assumption (A1), the recovered species have mortality rate μa0 and μb0 respectively. For human, they have a rate of λI to become carriers. Humans in carrier state are denoted as Ch, which has mortality rate of μh0 and recovery rate of λC. Recovered humans are denoted by Rh, also with mortality rate of μh0.
Based on above discussion, the following flowchart can be constructed.
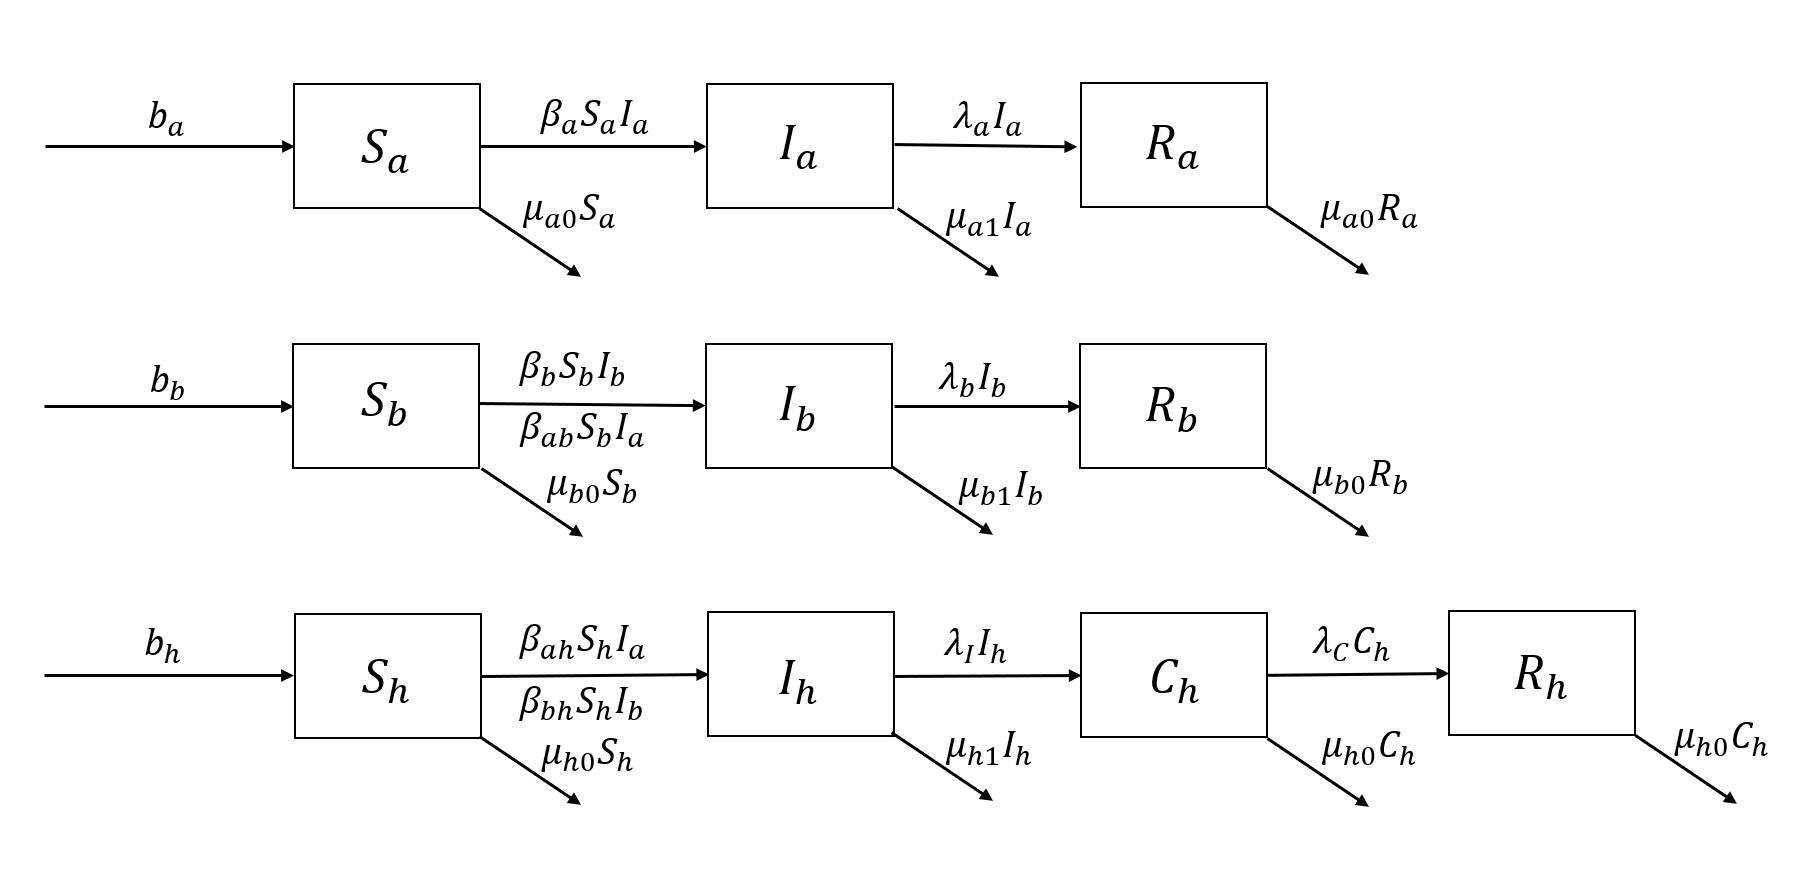
Figure 1. Flowchart of paragonimiasis transmission for the SICR model.
Figure 1 shows the flowchart of routes of transmission of paragonimiasis, including information for human population, snail population, and crustacean population. From Figure 1, we obtain the equations defining the model.
\( \begin{cases} \begin{array}{c} \frac{d{I_{a}}}{dt}={β_{a}}{S_{a}}{I_{a}}-{(λ_{a}}{I_{a}}+{μ_{a1}}{I_{a}}) \\ \frac{d{I_{b}}}{dt}={β_{b}}{S_{b}}{I_{b}}+{β_{ab}}{S_{b}}{I_{b}}-({λ_{b}}{I_{b}}+{μ_{b1}}{I_{b}}) \\ \frac{d{I_{h}}}{dt}={β_{ab}}{S_{h}}{I_{a}}+{β_{bh}}{S_{b}}{I_{b}}-({λ_{I}}{I_{h}}+{μ_{h1}}{I_{h}}) \\ \frac{d{C_{h}}}{dt}={λ_{I}}{I_{h}}-({λ_{c}}{C_{h}}+{μ_{h0}}{C_{h}}) \\ \frac{d{S_{a}}}{dt}={b_{a}}-({β_{a}}{S_{a}}{I_{a}}+{μ_{a0}}{S_{a}}) \\ \frac{d{R_{a}}}{dt}={λ_{a}}{I_{a}}-{μ_{a0}}{R_{a}} \\ \frac{d{S_{b}}}{dt}={b_{b}}-({β_{b}}{S_{b}}{I_{b}}+{β_{ab}}{S_{b}}{I_{b}}+{μ_{b0}}{S_{b}}) \\ \frac{d{R_{b}}}{dt}={λ_{b}}{I_{b}}-{μ_{b0}}{R_{b}} \\ \frac{d{S_{h}}}{dt}={b_{h}}-({β_{ab}}{S_{h}}{I_{a}}+{β_{bh}}{S_{b}}{I_{b}}+{μ_{b0}}{S_{h}}) \\ \frac{d{R_{h}}}{dt}={λ_{c}}{C_{h}}-{μ_{h0}}{C_{h}} \end{array} \end{cases}\ \ \ (1) \)
3. Results
According to the above differential equations, the disease-free equilibrium is given by:
\( {E_{0}}=(S_{a}^{0,0,0},S_{b}^{0,0,0},S_{h}^{0,0,0,0})\ \ \ (2) \)
Where
\( S_{a}^{0}=\frac{{b_{a}}}{{μ_{a0}}} , S_{b}^{0}=\frac{{b_{b}}}{{μ_{b0}}} , S_{h}^{0}=\frac{{b_{h}}}{{μ_{h0}}}\ \ \ (3) \)
Let
\( F=(\begin{matrix}{β_{a}}{S_{a}}{I_{a}} \\ {β_{b}}{S_{b}}{I_{b}}+{β_{ab}}{S_{a}}{I_{a}} \\ \begin{matrix}{β_{ah}}{S_{h}}{I_{a}}+{β_{bh}}{S_{h}}{I_{b}} \\ 0 \\ \begin{matrix}0 \\ 0 \\ \begin{matrix}0 \\ 0 \\ \begin{matrix}0 \\ 0 \\ \end{matrix} \\ \end{matrix} \\ \end{matrix} \\ \end{matrix} \\ \end{matrix})\ \ \ (4) \)
\( V=(\begin{matrix}{λ_{a}}{I_{a}}+{μ_{a1}}{I_{a}} \\ {λ_{b}}{I_{b}}+{μ_{b1}}{I_{b}} \\ \begin{matrix}{λ_{I}}{I_{h}}+{μ_{h1}}{I_{h}} \\ {λ_{c}}{C_{h}}+{μ_{h0}}{C_{h}}-{λ_{I}}{I_{h}} \\ \begin{matrix}{β_{a}}{S_{a}}{I_{a}}+{μ_{a0}}{S_{a}}-{b_{a}} \\ {μ_{a0}}{R_{a}}-{λ_{a}}{I_{a}} \\ \begin{matrix}{β_{b}}{S_{b}}{I_{b}}+{β_{ab}}{S_{b}}{I_{a}}+{μ_{b0}}{S_{b}}-{b_{b}} \\ {μ_{b0}}{R_{b}}-{λ_{b}}{I_{b}} \\ \begin{matrix}{β_{ah}}{S_{h}}{I_{a}}+{β_{bh}}{S_{h}}{I_{b}}+{μ_{h0}}{S_{h}}-{b_{h}} \\ {μ_{h0}}{C_{h}}-{λ_{c}}{C_{h}} \\ \end{matrix} \\ \end{matrix} \\ \end{matrix} \\ \end{matrix} \\ \end{matrix})\ \ \ (5) \)
Linearizing the above system at the disease-free equilibrium:
\( DF({E_{0}})=(\begin{matrix}F & 0 \\ 0 & 0 \\ \end{matrix})\ \ \ (6) \)
\( DV({E_{0}})=(\begin{matrix}V & 0 \\ {J_{3}} & {J_{4}} \\ \end{matrix})\ \ \ (7) \)
This gives
\( F=(\begin{matrix}{β_{a}}{S_{a}} & {β_{ab}}{S_{a}} & {β_{ah}}{S_{h}} & 0 \\ 0 & {β_{b}}{S_{b}} & {β_{bh}}{S_{h}} & 0 \\ 0 & 0 & 0 & 0 \\ 0 & 0 & 0 & 0 \\ \end{matrix})\ \ \ (8) \)
\( V=(\begin{matrix}{λ_{a}}+{μ_{a1}} & 0 & 0 & 0 \\ 0 & {λ_{b}}+{μ_{b1}} & 0 & 0 \\ 0 & 0 & {λ_{I}}+{μ_{h1}} & 0 \\ 0 & 0 & 0 & {λ_{c}}+{μ_{h0}} \\ \end{matrix})\ \ \ (9) \)
Computing the generation matrix, FV-1 gives
\( F{V^{-1}}=(\begin{matrix}\frac{{β_{a}}{S_{a}}}{{λ_{a}}+{μ_{a1}}} & \frac{{β_{ab}}{S_{a}}}{{λ_{b}}+{μ_{b1}}} & \frac{{β_{ah}}{S_{h}}}{{λ_{I}}+{μ_{h1}}} & 0 \\ 0 & \frac{{β_{b}}{S_{b}}}{{λ_{b}}+{μ_{b1}}} & \frac{{β_{bh}}{S_{h}}}{{λ_{I}}+{μ_{h1}}} & 0 \\ 0 & 0 & 0 & 0 \\ 0 & 0 & 0 & 0 \\ \end{matrix})\ \ \ (10) \)
The eigenvalues of FV-1 are
\( {a_{1}}=0\ \ \ (11) \)
\( {a_{2}}=0\ \ \ (12) \)
\( {a_{3}}=\frac{{β_{a}}{S_{a}}}{{λ_{a}}+{μ_{a1}}}\ \ \ (13) \)
\( {a_{4}}=\frac{{β_{b}}{S_{b}}}{{λ_{b}}+{μ_{b1}}}\ \ \ (14) \)
The eigenvalues correspond to the reproduction numbers of the model. To find out the basic reproduction number, we look for the greatest eigenvalue. Known that βa, Sa, βb, and Sb are all positive values, a1 and a2 cannot be the maximum eigenvalue. The basic reproduction number of the system is thus the maximum of a3 and a4. That is,
\( {R_{0}}=\underset{i∈\lbrace 3,4\rbrace }{max}{{a_{i}}}\ \ \ (15) \)
4. Analysis
Consider the expressions for R0, mortality rates μa1 and μb1 cannot be easily adjusted. With all other parameters kept constant, rate of infections βa and βb are directly proportional to R0. This means it is relatively effective to control rate of infections for snail population and crustacean population in order to reduce the basic reproduction number. However, consider the practicability of controlling rate of infection in multiple animal species, advanced technology and high cost mut be involved. Decreasing βa and βb is lacking feasibility. An alternative adjustment is regarding population of susceptible population of snails or crustaceans. Given that all factors are kept constant, a reduction in susceptible population for these animals will also lower the basic reproduction number linearly. Its effectiveness is theoretically the same as directly decreasing rate of infection. This approach is also more feasible. Eliminating snails or crustaceans can be done at a larger scale with relatively cheaper price. However, simply reducing these animals’ population will potentially cause environmental issue, and the disrupted ecosystem might have worse impact on human. Thus, unless carried out with costly environmental protection practices, reducing Sa or Sb is unsustainable from a long-run perspective. The third way to control basic reproduction number is by increasing the recovery rate of snails or crustaceans, λa and λb. Different from previous two approaches, this adjustment is inversely related to basic reproduction number. The effectiveness of decreasing recovery rate depends on the current value infection. Lower the rate of recovery, better the effectiveness in reducing reproduction number. Hence, whether this change should be carried out heavily depends on the recovery rate of infected snails and crustaceans. Due to its diminishing significance as recovery rate grows, it is considered less important than changes related to rates of transmission and size of susceptible populations. Evaluating its feasibility, raising animals’ recovery rate from paragonimiasis can be achieved by using targeted medicine over large scale. This method contains two problems. First, financial burden on developing and spreading such medicine could be heavy and cost performance could be poor. Second, large scale use of pharmaceutical products is likely to cause problem to non-target animals, further damaging the environment. Therefore, changing recovery rate of snails or crustaceans is not the preferable choice, due to its uncertain effectiveness, low cost performance, and environmental pollution.
However, certain assumptions made in the model can lead to inaccuracies and limitations in its application.
For assumption (A2), the compartmental model assumes that individuals move directly from the susceptible to the infected state without any delay. However, in reality there may be a period where individuals are infected but not yet infectious, known as the latent period. If the model does not account for the latent period, it may underestimate the rate of infection and the effectiveness of control measures.
For assumption (A3), the compartmental model assumes that transmission occurs only in one direction, neglecting the possibility of transmission from humans to other species, such as snails or crustaceans. This may underestimate the rate of infection and the impact of environmental factors on disease transmission.
For assumption (A4), the compartmental model assumes that the birth rate of each species is constant, which may not be the case in reality. The birth rate may vary based on factors such as seasonality, access to healthcare, and socio-economic status. Thus, the model fails to account regional and economical differences across the globe. Therefore, accounting for factors such as variations in, latent periods, inverse transmission, and birth rates can help improve the accuracy of the model and better inform public health decisions.
5. Conclusion
Intermediate hosts play an important role in the transmission of parasitic infectious diseases. This paper proposes a model for the influence of multiple intermediate hosts on the transmission of parasitic infectious diseases. It is assumed that susceptible people can be infected by contact with intermediate hosts and that intermediate hosts can be infected by contact with each other. The infection pattern was represented quantitatively by the simulation model, and the infection rate and recovery rate between different species were considered to simulate the transmission of paragonimiasis with the change of the SIR Model. The sensitivity analysis of the basic reproduction number on various model parameters indicates that it is crucial and effective to control rate of infections for snail population and crustacean population. However, neither simply eliminating the intermediate host nor improving the cure rate of the intermediate host paragonimiasis through large-scale use of targeted drugs can be achieved given the impact on the ecosystem and other practical factors. Therefore, health education about proper cooking of food before eating is the simplest practical way to control disease. Finally, we did not take into account the impact of environmental factors on the transmission of paragonimiasis. Some studies have shown that paragonimus westermani is highly likely to contaminate the environment such as water and soil, thus expanding the scope of infection. It can lead to limitations and inaccuracies in the application of the model.