


1. Introduction
One of the tasks of individual or institutional investors is to consider some prominent assets for profit maximization. Socially responsible investing (SRI) is a burgeoning investment approach that is brought into focus [1]. It seeks a balance among the environment, social and governance (ESG) instead of finance rewards merely [2]. Thus, figuring out the relationship between ESG and stocks portfolio performance is a challenging but meaningful task. Also, it is critical for improving portfolio theory and providing reliable suggestions for investors.
Precise prediction of price or return can bring higher extra return and lower risk during investing [3]. However, it is challenging to forecast for stocks market is a non-linear, complex and chaotic system. Fortunately, some research indicates machine learning models such as support vector regression (SVR), Random Forest, Long Short-Term Memory (LSTM), artificial neural networks (ANNs) and so on perform great in time series prediction [3-7]. Strategy of combining machine learning models with mean variance optimization has shown a fantastic result which exceeds portfolio with equal weight [8,9]. However, the limited studies about socially responsible investment which was attracted great attentions for academia and industry in the past decade [10]. For example, research utilizes deep learning and ESG scores into a portfolio optimization model [11]. Although machine learning is an excellent technique for forecasting, but few studies have focused on ESG stocks and investor portfolio returns. According to this, the research aims to predict the price of considered ESG stocks by machine learning for comparing and testing portfolio returns.
Based on these findings, this research creates a portfolio to confirm and compare ESG stocks in the American stock market through three steps. First, select small-cap stocks with high ESG scores in different industries to avoid unsystematic risks. Second, this article adopts Support Vector Regression (SVR), Random Forest (RF), and Linear Regression to predict the exact price of the ESG stocks. Results indicate that SVR offers better performance in forecasting. Finally, according to the weights of stocks by mean-variance optimization, it is easy to calculate the precise return of different predictions. The results demonstrate that although ESG stocks cannot bring extra profit during a bearish market, a portfolio consisting of ESG stocks shows prominent resilience.
The possible contributions may provide are the following two parts. First, combine machine learning methods with ESG stock price prediction. The results show that it is feasible to give precise predictions for price and return. Second, the research indicates that the same weight of assets is a simple and reliable approach to allocate assets. Particularly in a bearish market, finding the maximum Sharpe ratio and declining variance are more likely to keep the return of assets. The same weight allocation is an effective principle in a specific condition.
The remainder of the paper is structured as follows. The second and third parts describe the data source and the different methods that will be used. The fourth part analyzes the comparison of three models, the weight of stocks in the portfolio, and the portfolio return compared with the S&P 500. The fifth section provides findings and suggestions.
2. Data
The article obtained a dataset that includes ten selected stocks from January 1st, 2022, to December 31st, 2022, from Yahoo Finance by importing a module into Python. Excellent assets are vital before constructing the best optimum portfolio. Also, choosing some stocks from different industries is a great method to avoid unsystematic risks. Thus, the dataset used in the article is selected from ten industries, which are basic materials, communication services, consumer cyclical, consumer defensive, energy, healthcare, industrials, real estate, technology, and utilities in the American stock market. This research aims to create a portfolio based on predictions of ESG stock returns. It tries to search for some stocks with high ESG scores and less caps for these stocks may provide excess returns in a bearish market. Eventually, these stocks are shown in Table 1 and Figure 1.
Table 1: Ten considered stock.
Industries | basic materials | communication services | consumer cyclical | consumer defensive | energy |
Stocks | BHP | SMTOF | LAMR | COTY | CHEOF |
Industries | healthcare | industrials | real estate | technology | utilities |
Stocks | PNW | LBTYA | GLPEF | UHAL | NCR |
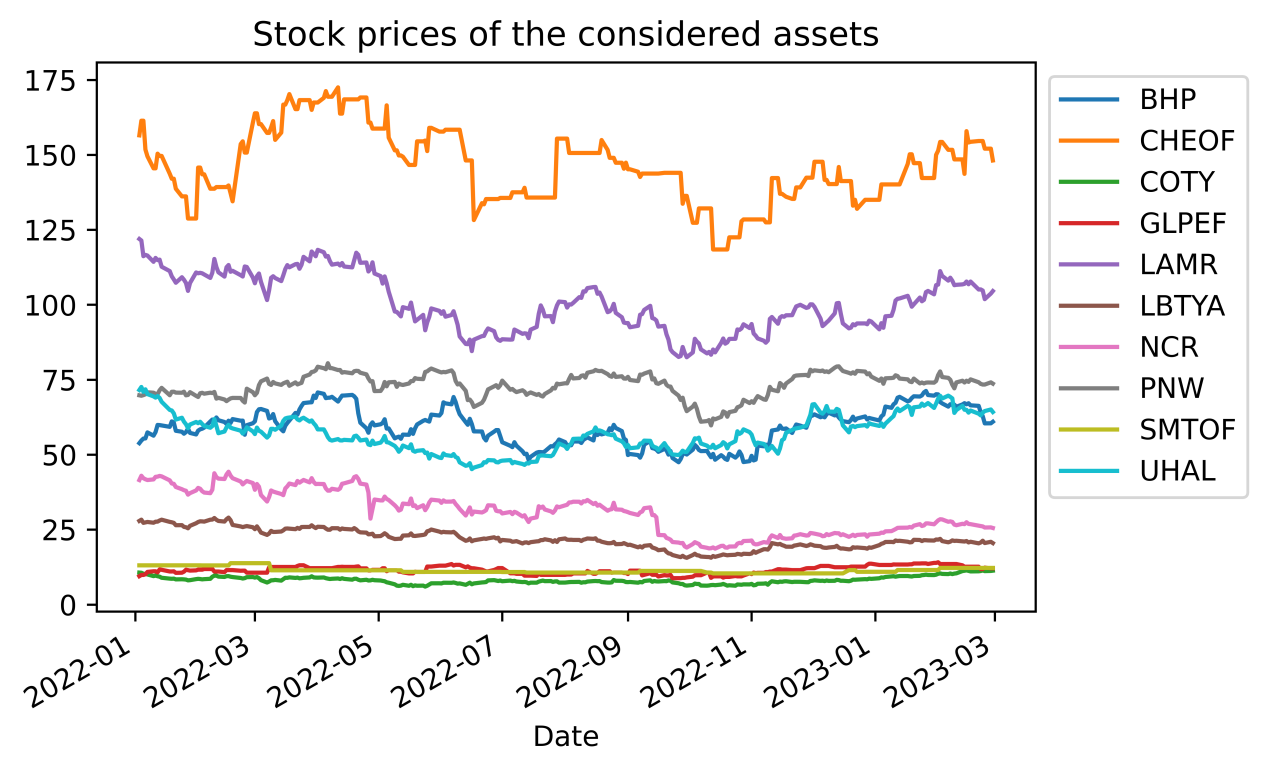
Figure 1: Stock price of the considered assets.
3. Methods
3.1. Sliding Windows
Stocks prices are time series data which means the day before some days influence today’s price significantly. Thus, this paper selects price in time t to predict price in time t+1 considering the price is changing all the time. This approach is called as sliding windows used by Kelly and Xiu [12]. In this approach, train data and test data are sliding in a specific time period which is 30 days in this study and both data are consecutive with time-series structure. The train data is 70% of whole dataset, which is used to train models. Another part of dataset is testing data used in prediction and it just is one day in a sliding window.
The article adopt traversal approach to stack 30 days of stocks(xt) price into a single vector to constitute a matrix and their prediction(yt) into another matrix. To represent this more formally, let yi, t+1 denote the price of stock i at dayt + 1, and let Xt contain xt-1 to xt-31 and prediction in dayt+31, which means \( {X_{i,t}}=\sum _{a=1}^{31}{x_{i,t-a}} \) . This method can ensure all of test data can be utilized to predict. All in all, the prediction approach can be showed in the following formula.
\( {y_{t+1}}=f({X_{t}})+{ε_{t}} \) (1)
Investors always to optimize their assets for higher return and less risk, and it is this research’s purpose. Thus, main idea in the paper is that predict the selected stocks price for making optimization basing on maximum sharpe and minimum volatility. This strategy is divided into three parts shown in the following context.
3.2. Support Vector Regression
Support vector machine is a supervised machine learning algorithm used in classification and regression which is support vector regression (SVR) the paper adopted. SVR is effective to create hyperplane in the dataset to ensure the distance is max. Facing some different problems, SVR convert some nonlinear regression into linear problem. This research sets up some hyperparameters to avoid overfitting problem and the exact parameters list in Table 2.
Table 2: Parameter of SVR.
parameter | value |
C | 5 |
gamma | 0.005 |
coef | 50 |
tol | 0.001 |
epsilon | 0.001 |
3.3. Random Forest (RF)
Random forest as a machine learning method introduced by Random Forests has been used widely by aggregating several decisions trees to offer solution. While it always converges, it is a suitable approach to forecast stock price. In machine learning, parameters of Random Forest include number of estimators, numbers of features to consider, the minimum number of samples need to be spilt, the minimum number of samples’ leaves, max depth and so on. After many tests, this article determines the final parameter is showed in Table 3.
Table 3: Parameter of RF.
parameter | value |
Max-depth | 10 |
Number of estimators | 40 |
Minimum number of samples’ leaves | 2 |
he minimum number of samples spilting | 2 |
3.4. Linear Regression (LR)
Linear regression basing on OLS optimization is a classical approach for estimation and prediction. It may present a worse performance comparing to machine learning or deep learning for there are no hyperparameters in the regression. Thus, the paper decides to adopt lasso regression to replace it. LASSO shrink regression coefficients by imposing a penalty on their size.
3.5. Mean Variance Optimization
Mean variance optimization is a mathematical approach to balance between risk minimum and return maximization. The expected return is calculated as follows.
\( {μ_{p}}=\sum _{i}{w_{i}}{μ_{i}}\ \ \ (2) \)
Where \( {w_{i}} \) is the \( {i^{th}} \) component weight of the portfolio, \( {μ_{i}} \) is the expected return of the \( {i^{th}} \) component. The variance of the portfolio is shown as below.
\( σ_{p}^{2}=\sum _{i}μ_{i}^{2}w_{i}^{2}\sum _{i}\sum _{j}{σ_{i}}{σ_{j}}{w_{j}}{w_{i}}{ρ_{ij}}\ \ \ (3) \)
Where \( {σ_{i}} \) is the standard deviation of the asset \( i \) returns, and \( {ρ_{ij}} \) is the correlation coefficient between the returns on assets \( i \) and \( j \) . The Monte Carlo simulation is utilized in this study to create multiple portfolios. This technique involves simulating the operation process as a series of random events, based on given parameters such as the average return and covariance matrices of the stocks. By stochastically generating weights for each asset in the portfolio, it is able to determine the expected return and variance of the portfolios under the given weights. By repeating this simulation process for one hundred thousand portfolios, this research obtains a representative data pool of the most probable asset allocations, which could then be used to plot the efficient frontier.
4. Results
4.1. Result for Stock Return Prediction
In the study, mean absolute error (MAE), mean squared error (MSE) and root mean square error (RMSE) are adopted to measure. Table 4 denotes the performance of different models. Obviously, SVR model indicates the best performance in all of models because mean or max of MAE, MSE and RMSE are less than others.
Table 4: Prediction of different models.
Model | MAE | MSE | RMSE | |
SVR | mean | 0.0536 | 0.0066 | 0.0703 |
max | 0.1321 | 0.0240 | 0.1550 | |
min | 0.0227 | 0.0030 | 0.0551 | |
RF | mean | 0.0939 | 0.0197 | 0.1167 |
max | 0.2976 | 0.0937 | 0.3061 | |
min | 0.0228 | 0.0010 | 0.0314 | |
LR | mean | 0.1852 | 0.0885 | 0.2276 |
max | 0.5956 | 0.4646 | 0.6816 | |
min | 0.0616 | 0.0056 | 0.0749 |
4.2. Result for Portfolio Optimization
The outcomes of various mean variance optimization (MOV) models’ experimental results are showed in this section. 100,000 simulations had been performed using the Monte Carlo method. The scatter plots of portfolio in the first day of prediction by SVR, RF and LR are presented in the Figure 2, Figure 3 and Figure 4, respectively.
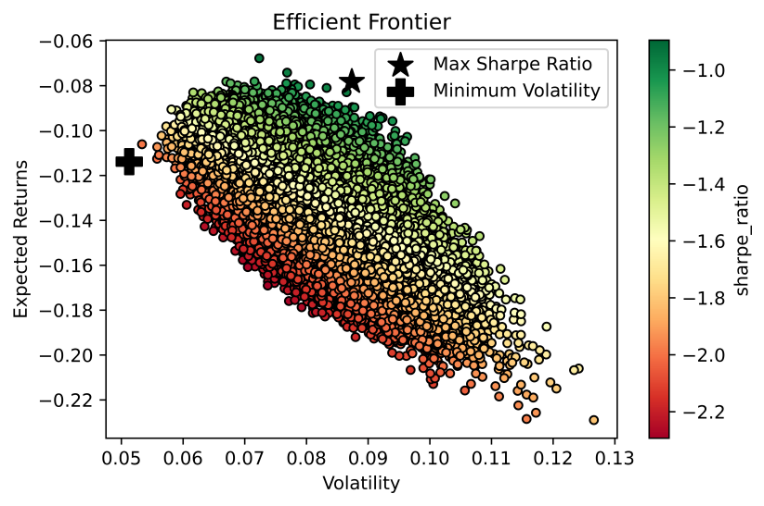
Figure 2: Efficient frontier of SVR.
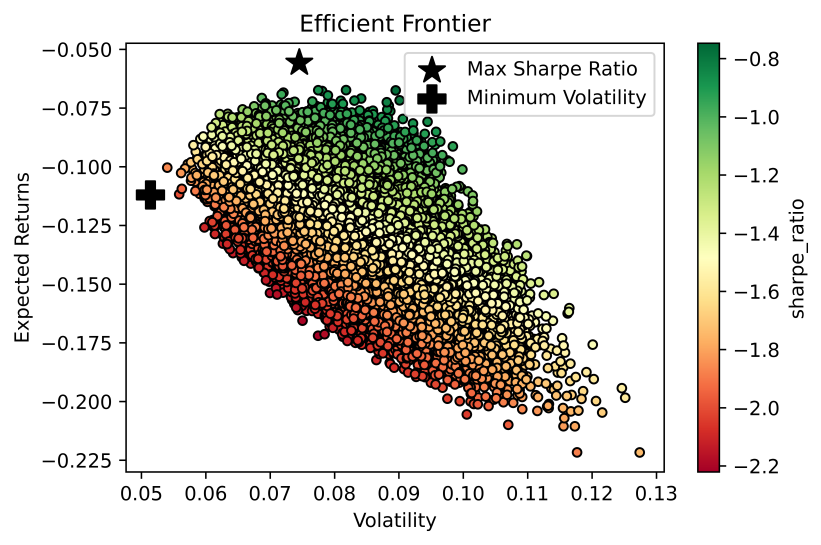
Figure 3: Efficient frontier of RF.
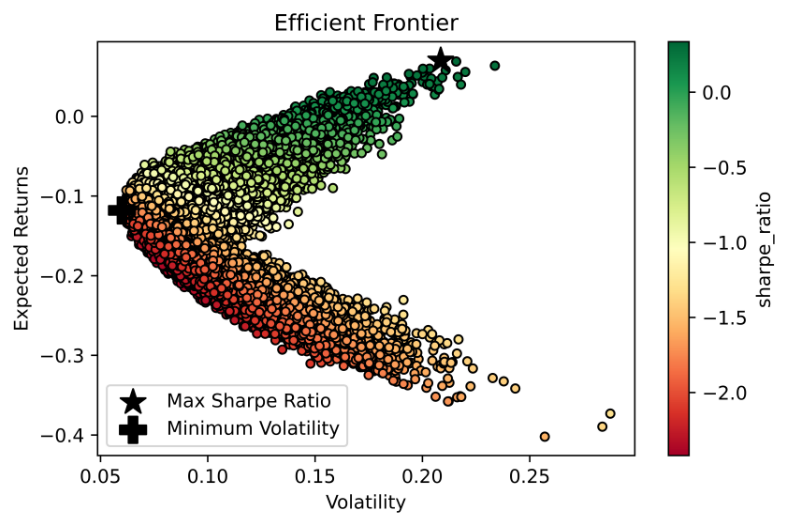
Figure 4: Efficient frontier of LR.
It is hardly to present weights of all of stocks for the weights of them are changing every day. However, main trend of weights of them can demonstrated in the Tables 5, 6 and 7. In the three tables, the mean weight is close to other stocks, which means in the most situations, allocating the same weight for all of assets is a simple but effective method to decline risk whatever purpose is chasing max sharpe ratio or min variance.
Table 5: Weight of portfolio by SVR.
Maximum sharpe ratio | Minimum variance | |||||||
Stocks | mean | sd | min | max | mean | sd | min | max |
BHP | 0.109 | 0.0872 | 0.00297 | 0.344 | 0.059 | 0.059 | 0.001 | 0.234 |
SMTOF | 0.138 | 0.0917 | 0.00282 | 0.321 | 0.196 | 0.097 | 0.005 | 0.434 |
LAMR | 0.112 | 0.120 | 9.61e-05 | 0.341 | 0.048 | 0.052 | 0.001 | 0.201 |
COTY | 0.0919 | 0.0982 | 0.00254 | 0.292 | 0.051 | 0.046 | 0 | 0.178 |
CHEOF | 0.0944 | 0.0856 | 0.00132 | 0.394 | 0.144 | 0.057 | 0 | 0.254 |
PNW | 0.128 | 0.101 | 0.000217 | 0.314 | 0.135 | 0.089 | 0.002 | 0.339 |
LBTYA | 0.0734 | 0.0762 | 0.00136 | 0.274 | 0.097 | 0.067 | 0.002 | 0.266 |
GLPEF | 0.141 | 0.0863 | 0.000582 | 0.329 | 0.144 | 0.079 | 0.001 | 0.316 |
UHAL | 0.0986 | 0.0910 | 0.00231 | 0.332 | 0.112 | 0.081 | 0.001 | 0.26 |
NCR | 0.0136 | 0.0133 | 0.000428 | 0.0571 | 0.016 | 0.018 | 0 | 0.094 |
Table 6: Weight of portfolio by RF.
Maximum sharpe ratio | Minimum variance | |||||||
Stocks | mean | sd | min | max | mean | sd | min | max |
BHP | 0.0407 | 0.0435 | 0.000387 | 0.189 | 0.0755 | 0.0686 | 0.000321 | 0.300 |
SMTOF | 0.228 | 0.109 | 0.00682 | 0.434 | 0.111 | 0.0898 | 0.00182 | 0.276 |
LAMR | 0.0197 | 0.0212 | 0.000798 | 0.105 | 0.0638 | 0.0864 | 9.61e-05 | 0.341 |
COTY | 0.0429 | 0.0381 | 0.00287 | 0.207 | 0.141 | 0.116 | 0.000292 | 0.396 |
CHEOF | 0.137 | 0.0612 | 0.000315 | 0.236 | 0.0948 | 0.0641 | 0.00662 | 0.267 |
PNW | 0.199 | 0.0848 | 0.00911 | 0.313 | 0.106 | 0.103 | 0.000217 | 0.325 |
LBTYA | 0.0744 | 0.0396 | 0.00171 | 0.180 | 0.121 | 0.101 | 0.00136 | 0.370 |
GLPEF | 0.171 | 0.0726 | 0.0368 | 0.365 | 0.163 | 0.0718 | 0.00130 | 0.322 |
UHAL | 0.0652 | 0.0683 | 0.00289 | 0.243 | 0.109 | 0.0970 | 0.000822 | 0.350 |
NCR | 0.0225 | 0.0183 | 0.000424 | 0.0888 | 0.0155 | 0.0199 | 0.000222 | 0.112 |
Table 7: Weight of portfolio by LR.
Maximum sharpe ratio | Minimum variance | |||||||
Stocks | mean | sd | min | max | mean | sd | min | max |
BHP | 0.0815 | 0.0704 | 0.000859 | 0.268 | 0.0593 | 0.0583 | 0.000372 | 0.226 |
SMTOF | 0.144 | 0.0990 | 0.00111 | 0.333 | 0.190 | 0.0909 | 0.00410 | 0.364 |
LAMR | 0.0791 | 0.0806 | 9.78e-05 | 0.341 | 0.0488 | 0.0535 | 9.78e-05 | 0.201 |
COTY | 0.138 | 0.111 | 0.00287 | 0.401 | 0.0481 | 0.0432 | 0.000180 | 0.178 |
CHEOF | 0.0983 | 0.0706 | 0.00105 | 0.306 | 0.144 | 0.0608 | 0.0352 | 0.292 |
PNW | 0.0983 | 0.102 | 0.000217 | 0.315 | 0.146 | 0.0860 | 0.00154 | 0.339 |
LBTYA | 0.106 | 0.0903 | 0.000542 | 0.325 | 0.0960 | 0.0682 | 0.00159 | 0.266 |
GLPEF | 0.144 | 0.0827 | 0.00448 | 0.330 | 0.142 | 0.0818 | 0.00130 | 0.365 |
UHAL | 0.0885 | 0.0813 | 0.000822 | 0.332 | 0.110 | 0.0797 | 0.00134 | 0.260 |
NCR | 0.0231 | 0.0247 | 0.000435 | 0.139 | 0.0151 | 0.0158 | 0.000166 | 0.0942 |
Table 8 provides return and volatility of the two portfolios including mean, min, max and deviation for the same reason. The research finds out the return of max sharpe ratio portfolio from RF prediction is the highest (0.35%) and result is familiar with research by Yilin Ma [1]. It offers a better portfolio although the residual of prediction is larger than SVR.
Table 8: Cumulative return comparison.
approach | portfolio | Cumulative Return |
S&P 500 | -0.80% | |
SVR | Max Sharpe Ratio | -0.80% |
Min Volatility | -0.50% | |
RF | Max Sharpe Ratio | 0.35% |
Min Volatility | -0.02% | |
LR | Max Sharpe Ratio | 0.09% |
Min Volatility | -0.39% |
After obtaining the two portfolios, it allows us to make a comparison for these portfolios with equal weight portfolio and S&P 500. To presenting them clearly, the research use cumulative return of all of them for comparison. In Figure 5, although both of portfolios still provide the familiar return in a bearish period, portfolio with maximum sharpe and minimum variance show better when return decrease significantly. In other figures (Figure 6 and Figure 7), the result is similar.
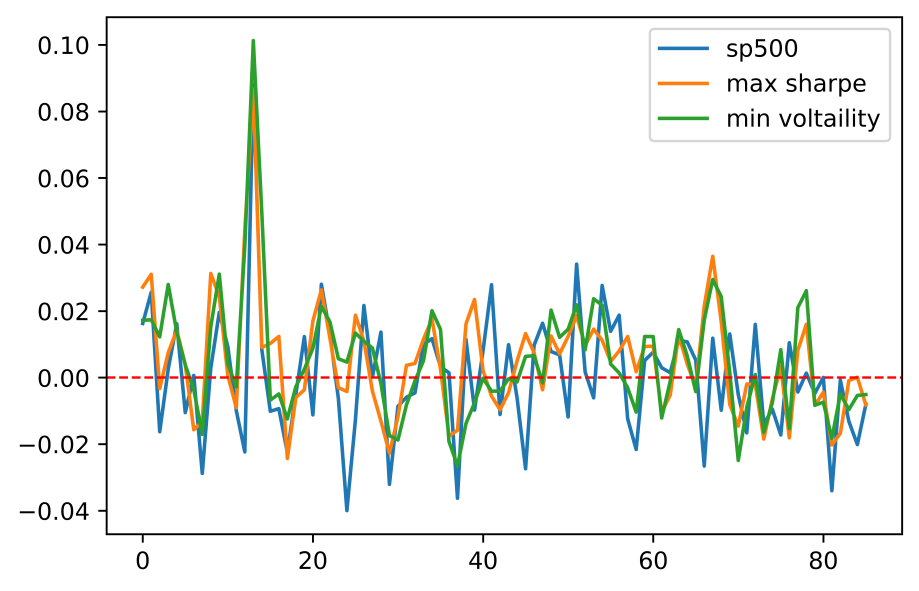
Figure 5: Comparison between S&P 500 index and the altered portfolio returns by SVR.
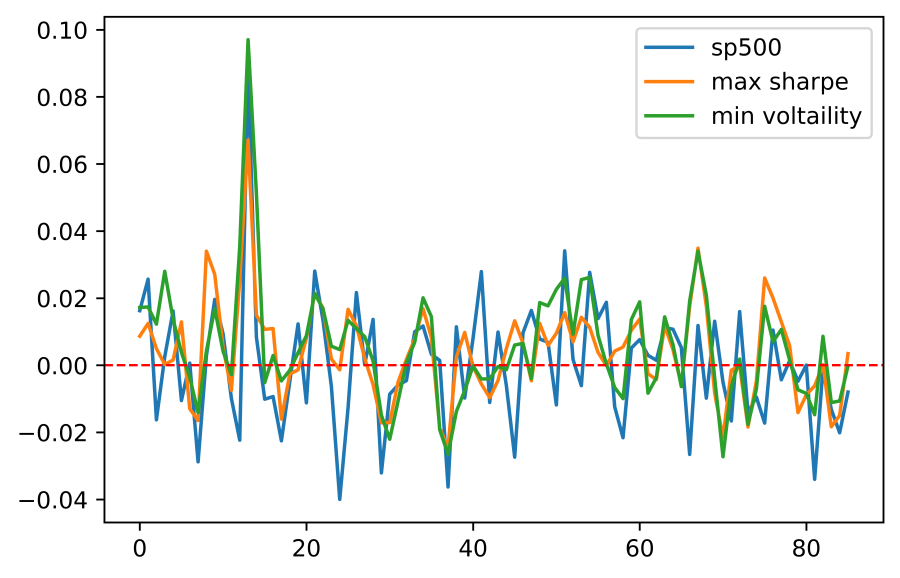
Figure 6: Comparison between S&P 500 index and the altered portfolio returns by RF.
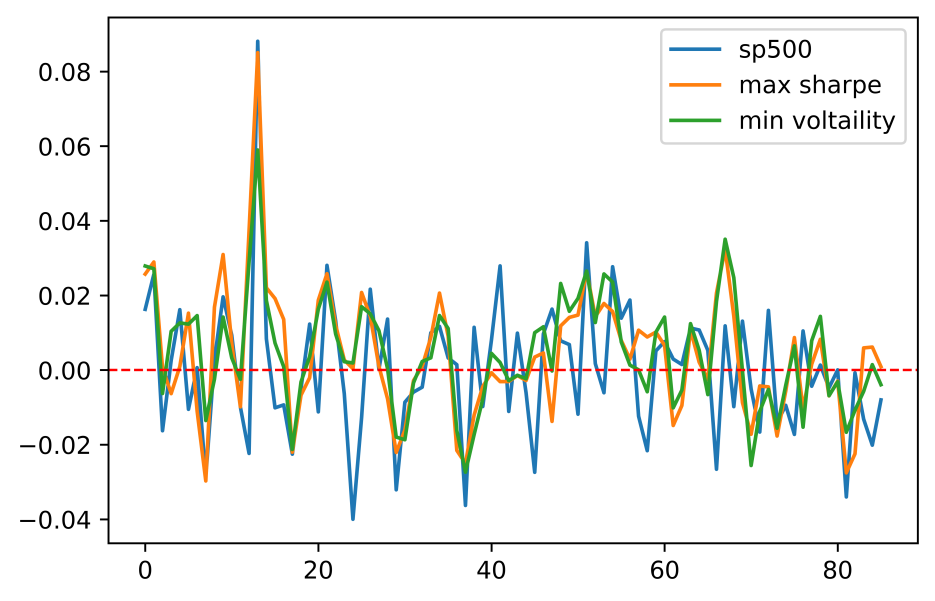
Figure 7: Comparison between S&P 500 index and the altered portfolio returns by LR.
5. Conclusion
In the paper, this paper searches two portfolios (minimum variance and maximum Sharpe ratio) from ten stocks in American markets with higher ESG scores. This paper adopts three machine learning approaches to predict for obtaining the expect return and covariance. The article calculates one hundred thousand random portfolios by Monte Carlo simulation and pinpoint maximum sharpe and minimum variance with mean variance optimization by visualization. Results indicates that both maximum sharpe and minimum variance portfolio have similar highest return and higher lowest return comparing with S&P 500. In the models, SVR offers the lowest residual and mean variance optimization with random forest forecasts performs the best.
In this research, there are some aspects of improvements. First, the machine learning approach used in the article can be combined to ensemble learning which has greater efficient and accuracy of prediction. Second, windows of prediction should be expanded, which could involve more conditions or shocks for checking its performance thoroughly. Third, the considered stocks may have scientific selecting methods instead of relying on a few indicators.