1. Introduction
In recent years, Environmental, Social, and Governance (ESG) investing has gained widespread attention globally. By the end of 2023, over 5,300 institutional investors and service providers had signed the Principles for Responsible Investment (PRI), representing assets under management exceeding $121 trillion. This development clearly demonstrates the commitment of financial markets to integrating ESG standards into investment decision-making.
ESG practices, once viewed as a framework for fulfilling corporate social responsibility, are now recognized as an integral part of achieving long-term financial performance. This shift is driven by increasingly stringent regulatory requirements and the growing demand for sustainability from stakeholders. The United Nations’ milestone report “Who Cares Wins” was the first to introduce the term ESG, where it emphasized the importance of integrating environmental, social, and governance factors into business practices. Furthermore, it encouraged regulators, rating agencies, companies, and investors to adopt ESG criteria in decision-making. This marked a transition from Corporate Social Responsibility (CSR), which was sometimes vague, to ESG, which provides measurable and transparent indicators that hold companies accountable. Governments, investors, and consumers are all pushing businesses to incorporate ESG principles into their strategic focus and investment decisions.
At the same time, issues such as climate change, social inequality, and governance scandals have become increasingly prominent, further underscoring the importance of aligning business operations with sustainable goals. For example, according to the Intergovernmental Panel on Climate Change, global warming has increased the frequency of natural disasters, presenting significant challenges for businesses’ supply chain management and long-term operations. Trinks et al. found a significant relationship between climate risks and corporate financial performance, with companies that actively address climate change tending to achieve higher investment returns[1]. Kolk and Van Tulder highlighted that corporate social responsibility not only addresses social inequality but also enhances a company’s reputation, leading to better financial performance[2]. As these global issues intensify, businesses increasingly recognize that adopting ESG initiatives can help mitigate risks posed by external factors, and by fostering innovation, improving operational efficiency, and enhancing corporate reputation, they can create long-term value. This further solidifies ESG’s critical role in contemporary corporate strategy and financial decision-making.
Understanding the impact of ESG practices on corporate performance is of both practical and academic significance. From a practical perspective, ESG initiatives can positively impact financial outcomes by enhancing corporate reputation, attracting socially responsible investors, and strengthening trust among consumers and employees. Moreover, strong ESG performance can reduce operational risks, minimize regulatory fines, and optimize resource allocation, thereby improving profitability. From an academic perspective, the relationship between ESG and financial performance remains a topic of debate. While some studies show a positive correlation between the two, others argue that ESG investments may lead to additional costs without necessarily guaranteeing returns. This research aims to contribute to this ongoing discussion by analyzing how ESG factors dynamically influence key financial indicators, such as return on assets (ROA). The findings will provide actionable recommendations for business leaders, policymakers, and investors seeking to balance sustainability and profitability.
The primary objective of this study is to bridge the gap between ESG theory and practice and analyze how ESG scores affect corporate performance. Specifically, this study aims to evaluate the overall impact of ESG practices on corporate financial performance through different models, with a focus on ROA. We explore the heterogeneous impact of ESG dimensions on corporate performance, and improve the predictive accuracy of the relationship between ESG and financial performance by employing various models including a linear model, Principal Component Analysis (PCA), and various machine learning models including the random forest, XGBoost and CatBoost model. We provide empirical evidence and methodological insights that are useful for both academic research and practical applications.
2. Literature Review
Several studies have found a significant positive correlation between overall ESG scores and corporate financial performance. For example, Fu and Li used A-share listed companies in China from 2015 to 2021 and found that ESG positively and significantly affects corporate financial performance, with digital transformation driving this effect[3]. Yangsoo Jin found a positive correlation between ESG scores and return on assets (ROA) and return on equity (ROE) for listed companies in South Korea[4]. Similarly, Caterina De Lucia used machine learning models to verify the predictive advantage of ESG scores on financial performance, further confirming that companies with high ESG scores perform better in financial health and long-term profitability[5]. A meta-analysis by Whelan et al. reviewed over 1,000 studies from 2015 to 2020 and found that 58% of studies showed a positive relationship between ESG and financial performance[6].
The positive relationship between ESG and firm performance can be explained through several theoretical frameworks. First, Freeman’s stakeholder theory emphasizes that corporate success depends not only on maximizing shareholder value but also on coordinating and meeting the needs of all stakeholders, such as employees, consumers, suppliers, and governments[7]. One of the core objectives of ESG practices is to meet the diverse needs of stakeholders. For example, the environmental dimension (E) addresses the community and government’s concerns about sustainability, the social dimension (S) enhances employee and consumer satisfaction, and the governance dimension (G) strengthens investor confidence in corporate management. Therefore, high levels of ESG performance can enhance corporate reputation, improve consumer loyalty, and attract long-term investments, which in turn drives corporate financial performance and overall value. Second, Barney’s theory of sustainable competitive advantage further argues that companies can achieve long-term market leadership by innovating, optimizing resources, and differentiating their strategies[8]. ESG practices can help companies reduce operating costs, enhance brand image, and increase market share through environmental protection (e.g., reducing carbon emissions), social responsibility (e.g., fair treatment of employees and customers), and governance optimization (e.g., transparent management structures). Additionally, Miller’s risk management theory emphasizes that companies can reduce potential losses and improve operational stability by identifying and managing internal and external risks[9]. ESG practices provide a systematic framework for risk identification, assessment, and mitigation. For example, investing in green technologies and controlling carbon emissions can reduce the potential damage caused by natural disasters or environmental policy changes; fulfilling social responsibility can reduce labor disputes and community conflicts; and effective governance structures can reduce the risk of financial fraud and internal management failures. Therefore, effective ESG strategies help companies identify and avoid key risks, thus reducing costs and mitigating the negative impact of potential crises on financial performance.
However, some studies also reveal that there may be a non-linear relationship between ESG and financial performance. Some scholars have found that ESG investment follows a U-shaped or inverted U-shaped trend, with companies finding their threshold of ESG activities to gain maximum benefits, balancing social responsibility and financial goals being crucial[10][11].
Regarding the three dimensions of ESG, the impact on financial performance is mostly positive. In the environmental dimension, the application of green technologies and control of carbon emissions can enhance market competitiveness and profitability by reducing carbon emissions and optimizing resource allocation. At the same time, these measures can attract more green investments focused on sustainability, as consumers’ preference for environmentally friendly products and higher brand loyalty make them willing to pay a premium for such products[12]. In the social dimension, CSR practices focusing on employee welfare, customer relations, and community responsibility can improve employee satisfaction, which in turn further enhances financial performance[13]. In the governance dimension, a robust corporate governance structure helps improve transparency, reduce capital costs, and enhance investor trust, thus improving financial performance[14][15]. However, the impact of the different ESG dimensions on corporate performance may vary. For instance, research by Shaikh found that governance improves operational efficiency, while the environmental and social dimensions can have a negative impact[16]. Segura et al. found that both environmental and social dimensions have a positive impact on market value and financial performance, with the social dimension having the most significant effect on performance, while governance did not show a significant impact on market value[17]. Therefore, although all three dimensions generally have a positive impact on financial performance, their specific effects can vary depending on different studies.
In recent years, with the advancement of data analysis technology, research methods have gradually shifted from traditional regression analysis to cutting-edge technologies such as machine learning. While traditional regression models reveal the direct impact of ESG scores on financial indicators, they have limitations in handling complex non-linear relationships. In contrast, machine learning methods can more effectively capture these complex relationships. Bai and Huang used the CatBoost algorithm and random forest models and found that incorporating ESG scores into bond default risk prediction significantly improves model accuracy, offering new perspectives for research in this area[18]. Therefore, combining traditional regression methods with machine learning techniques will help provide a more comprehensive understanding of the relationship between ESG and corporate financial performance. This study plans to compare these two methods, aiming to improve the accuracy and robustness of the model and provide more reliable decision-making guidance for businesses and investors.
3. Data
3.1. Sample selection and Data Source
This study selects U.S. publicly listed companies from 2018 as the sample to examine the impact of ESG performance across three dimensions on firm performance. These companies represent a broad range of industries and market sectors, ensuring strong representativeness. ESG-related data and firm performance data are both sourced from Kaggle, an online platform specializing in data science and machine learning. Specifically, the ESG data comes from the "ESG Dataset Starter," which includes levels, grades, and scores for the three ESG dimensions, as well as the total ESG score. Firm performance data is obtained from the "Financial Indicators of US Stocks" dataset, which includes revenue, ROA, and ROE. Based on this, the financial data and ESG ratings are merged to create a new dataset for analysis. However, due to data availability constraints, some companies lacked complete ESG or financial data, and the final dataset was reduced to 586 companies.
3.2. ESG Score
The ESG scores for each dimension—environment, social, and governance—are rated on a scale from 0 to 1000. The total ESG score, which is the sum of the three individual scores, ranges from 0 to 3000.
The correlation structure (correlation matrix to be specific) reveals significant positive relationships among the three ESG dimensions: environmental, social, and governance. The Pearson correlation coefficient between environmental and social scores is 0.644, indicating a moderate positive correlation, suggesting that companies performing well in the environmental dimension also tend to perform well in social responsibility. Similarly, the correlation between environmental and governance scores is 0.571, reflecting a moderate level of positive association, implying that investments in environmental protection are often accompanied by improved governance practices. Additionally, the correlation coefficient between social and governance scores is 0.449, which, while slightly lower, still indicates a positive relationship. These findings suggest that the three ESG dimensions are not independent but are interrelated, with strong performance in one dimension often accompanied by improvements in the others. This supports the validity of the ESG framework as a comprehensive approach to evaluating corporate sustainability practices.
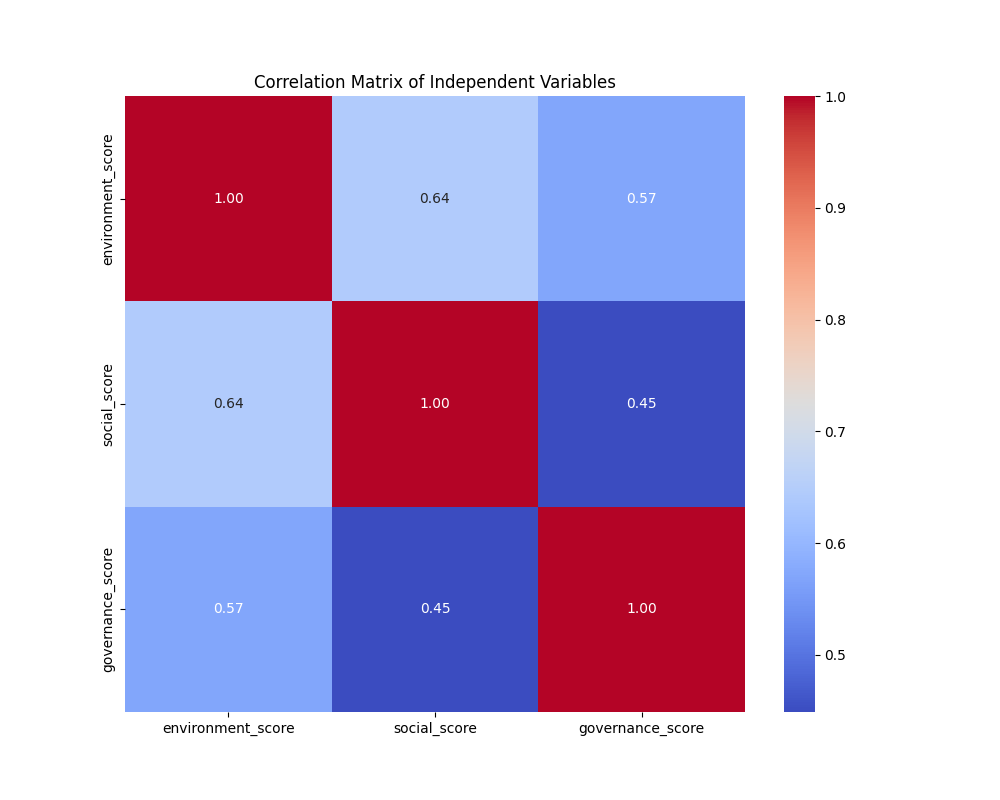
Figure 1: Correlation Matrix of the Three Dimensions of ESG Scores.
3.3. Firm Performance
Firstly, ROA is used as the response variable to reflect the firms’ financial performance. It is worth noting that ROA measures a company's efficiency in generating profits using its assets, which directly reflects its operational efficiency and asset management capabilities. In contrast, ROE measures a company's ability to generate profits using shareholder investments, which is more indicative of its profitability and growth in shareholder value. ROA is particularly important for evaluating how ESG (Environmental, Social, and Governance) factors influence company performance, as these factors are often closely linked to operational practices and resource management.
Secondly, ROA provides a relatively stable metric for assessing a company's efficiency in utilizing its assets, as it is less affected by changes in capital structure. This stability makes it a more consistent basis for comparisons across different industries and companies. In contrast, ROE's comparability may be affected by variations in capital structures across industries. For instance, capital-intensive industries may exhibit lower ROE values, which do not necessarily indicate poorer performance.
Last but not least, the distribution of ROA, as shown in the Figure 2, is relatively concentrated, with most companies’ ROA values near zero. This suggests that ROA is less prone to being skewed by extreme values, making it a more robust indicator for analysis.
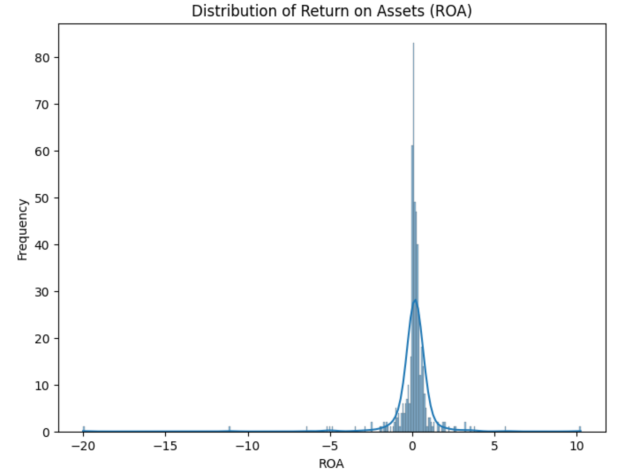
Figure 2: Distribution of Return on Assets.
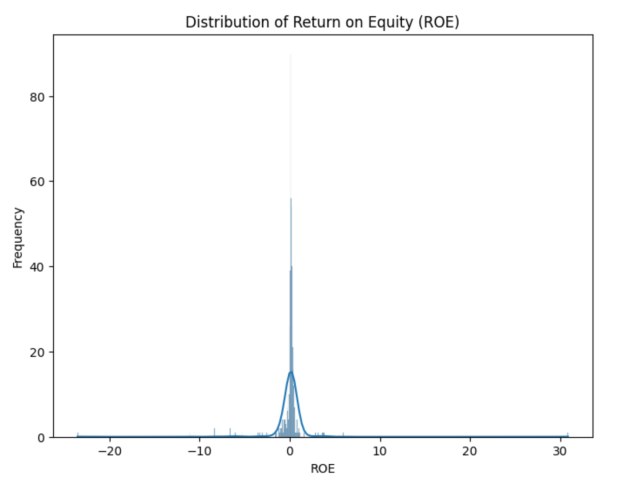
Figure 3: Distribution of Return on Equity.
4. Models and Empirical Results
4.1. Linear Regression Model
This study first uses the Ordinary Least Squares (OLS) regression model to analyze the relationship between firm performance (ROA) and Environmental, Social, and Governance (ESG) scores. The regression model is as follows:
\( {ROA_{i}}={β_{0}}+{β_{1}}{Environment score_{i}}+{β_{2}}{Social score_{i}}+{β_{3}}{Government score_{i}}+{ϵ_{i}} \) (1)
The performance of company i is represented by \( {ROA_{i}} \) , and the environmental, social, and governance (ESG) scores are denoted respectively by \( {Environment score_{i}} \) , \( {Social score_{i}} \) and \( { Government score_{i}} \) .
The regression results from Table 1 show that the social score has a significant positive effect on firm performance (ROA), with a coefficient of 0.0037 and a p-value of 0.014, indicating that an increase in the social score significantly improves firm performance at the 5% significance level. The environmental score and governance score do not appear to have a significant impact on firm performance. Both are negatively correlated, with p-values of 0.744 and 0.292, respectively, which are greater than 0.05 and therefore are not statistically significant.
Table 1: Linear Regression Result.
coef | std err | t | P>|t| | [0.025 | 0.975] | |
Intercept | 0.6609 | 0.010 | 63.617 | 0.000 | 0.640 | 0.681 |
Environment score | -0.0037 | 0.011 | -0.326 | 0.744 | -0.026 | 0.019 |
Social score | 0.0621 | 0.025 | 2.474 | 0.014 | 0.013 | 0.111 |
Governancescore | -0.0231 | 0.022 | -1.055 | 0.292 | -0.066 | 0.020 |
4.2. Principal Component Analysis
To better address multicollinearity and enhance the interpretability of the analysis, we employ Principal Component Analysis (PCA) on the Environment, Social, and Governance (ESG) scores. First, all variables are standardized by subtracting the mean and dividing by the standard deviation, and the first two principal components are extracted based on the scree plot results. These two components together explain 93.1% of the total variance.
The first principal component (PC1) carries larger weights, with strong positive correlations with the environment score (0.9281), social score (0.2741), and governance score (0.2522). The second principal component (PC2) is primarily composed of the governance score (0.9508), followed by the environment score (-0.2903) and the social score (0.1084). This indicates that PC2 captures a stronger association with the governance score while having a weaker correlation with the environment and social scores.
In the subsequent regression analysis, these two principal components were used as explanatory variables instead of the original ESG dimensions. The regression results show that the coefficient of PC1 is 0.0078, indicating a positive impact of the first principal component on ROA. Specifically, an increase of one unit in PC1 corresponds to an increase of 0.0078 units in ROA. On the other hand, the regression coefficient for PC2 is -0.0142, suggesting a negative impact of the second principal component on ROA, where each one-unit increase in PC2 results in a 0.0142 unit decrease in ROA.
\( {ROA_{i}}={β_{0}}+{β_{1}}{PC1_{i}}+{β_{2}}{PC2_{i}}+{ϵ_{i}} \) (2)
4.3. Random Forest Model
Random Forest, first introduced by Tin Kam Ho[19] and further developed by Leo Breiman[20] and Adele Cutler[21], is an ensemble learning method that combines multiple decision trees to improve the model's predictive accuracy and robustness. This method was chosen for its ability to handle complex interactions between variables and its robustness to overfitting. Yangsoo Jin used a Random Forest model to analyze the impact of Environmental, Social, and Governance dimensions on the Corporate Financial Performance of publicly listed companies in South Korea[4]. The study concluded that the Environmental and Governance dimensions have a positive impact on CFP, while the Social dimension has a negative impact on CFP. Furthermore, the study by Caterina De Lucia et al. demonstrated that the Random Forest model accurately predicted ROA and ROE, with prediction performance superior to that of the baseline model, and showed a positive relationship between ESG practices and financial indicators[5].
Therefore, based on previous research, after performing Min-Max normalization on the variables, this study employs a Random Forest model to analyze the relationship between firm performance (ROA) and its explanatory variables, including ESG scores and revenue. Additionally, a 5-fold cross-validation procedure was implemented to ensure the model's generalizability and assess its performance on unseen data. In this process, the dataset was split into five subsets, where four subsets were used for training and one subset for testing, iterating through all possible combinations.
The results indicate that the Random Forest model achieved a Root Mean Squared Error (RMSE) of 0.0216 and an R-squared value of 0.7928 on the training data, demonstrating strong predictive performance. The split-based feature importance from first row in Table 2 revealed that, putting aside revenue, the environment score had the highest relative importance (0.1543), followed by the social score (0.1456) and the governance score (0.0978). This suggests that the environment score contributes the most, followed by the social and governance scores, in explaining variations in ROA. The cross-validation results from Table 3 further validate the model’s stability and predictive capacity. The average RMSE was 0.0532, with a standard deviation of 0.0186, indicating consistent performance across the five folds.
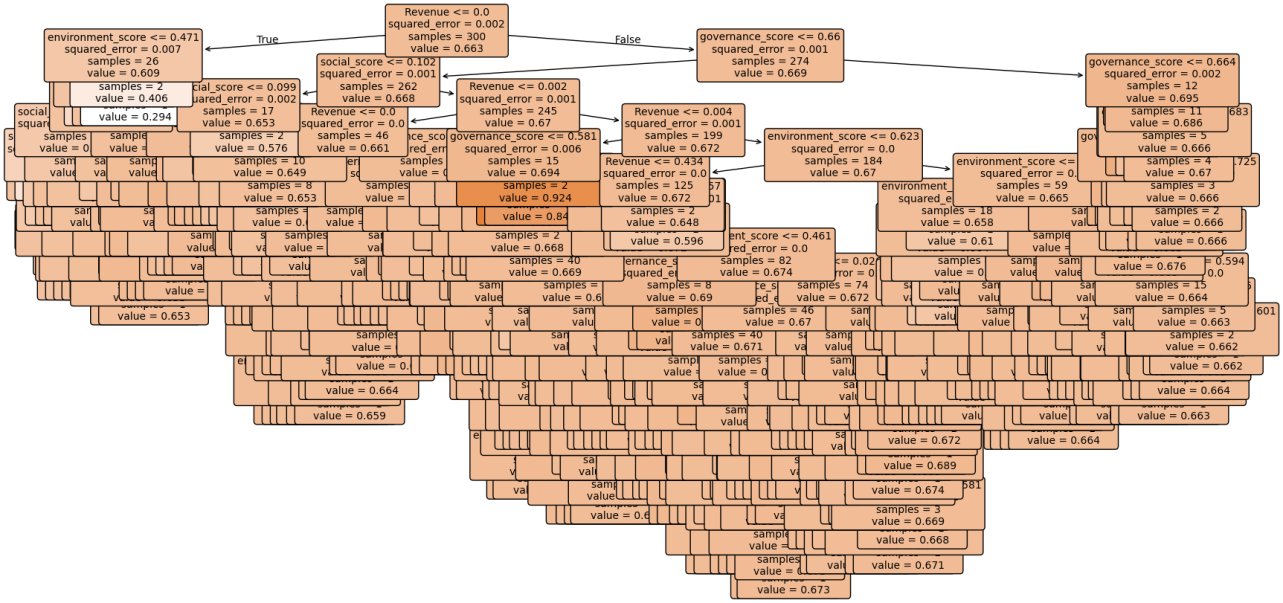
Figure 4: Decision Tree Visualization of Random Forest Model
4.4. XGBoost Model
XGBoost (Extreme Gradient Boosting) was proposed by Tianqi Chen[22] in 2016 and is an efficient machine learning algorithm based on gradient boosting decision trees (GBDT). Designed for speed and performance optimization, XGBoost is widely used in classification, regression, and ranking tasks, especially excelling in data science competitions and large-scale industrial applications. The core idea of XGBoost is to sequentially combine multiple decision trees within the gradient boosting framework, optimizing model performance by minimizing the loss function. In XGBoost, decision trees not only randomly select features but also reference the parameters of the previous tree as a basis for building the new decision tree. Compared to traditional GBDT methods, XGBoost introduces second-order gradient information, regularization terms, and parallel computing, which enhance training speed and reduce overfitting risks. Moreover, XGBoost employs built-in handling of missing values, custom loss functions, and advanced pruning strategies, making it highly adaptable and stable when working with large datasets and complex feature sets.
Lin and Hsu used the XGBoost algorithm to predict ESG scores and found that the XGBoost model exhibited similar or superior predictive performance compared to SVM and ELM models in most cases[23]. Their study also examined the impact of the COVID-19 pandemic on model accuracy, revealing that the predictive performance of XGBoost remained consistently high during both the pandemic and non-pandemic periods, with no significant differences. Building on top of their approach, this study applies the XGBoost regression model to analyze the relationship between firm performance (ROA) and its related independent variables.
From second row of Table 2, the split-based feature importance analysis of the model’s output shows that environment score, with a feature importance of 661.0, plays the most significant role in predicting firm performance, followed by social score (451.0) and governance score (270.0). This suggests that among ESG factors, environmental aspects contribute the most to explaining variations in ROA, while social and governance factors have a relatively lower impact. To evaluate the model's stability, a 5-fold cross-validation was then conducted, yielding an average RMSE of 0.0546 and a standard deviation of 0.0217, as shown in Table 3. The relatively low variability across different folds suggests that the model maintains a consistent predictive performance, indicating a reasonable level of generalizability.

Figure 5: Decision Tree Visualization of XGBoost Model
4.5. CatBoost Model
CatBoost is a machine learning algorithm developed by Yandex[24], based on gradient boosting trees, and optimized for handling categorical features. Compared to traditional gradient boosting methods such as XGBoost LightGBM, CatBoost does not require complex preprocessing (such as one-hot encoding) for categorical features, which makes it more efficient and is shown to perform better in many practical applications. Additionally, CatBoost reduces overfitting and provides stable predictions through its use of symmetric tree structures and optimized algorithms.
Bai and Huang used the CatBoost algorithm to improve traditional models to predict default rates of bonds and found a significant positive correlation between a company's ESG score and the default rate of its bonds[18]. They also demonstrated that the CatBoost method could more accurately assess the default risk of corporate bonds, and incorporating ESG scores improved the model's prediction accuracy. Building on that, this study applies the CatBoost regression model to analyze the relationship between firm performance (ROA) and its related independent variables.
The results from Table 2 shown that explanatory variables have varying degrees of impact on firm performance. The importance of features based on split criteria showed that, when putting aside revenue, the environment score has the highest impact (11.45), followed by the governance score (10.84), and the social score (6.29). This indicates that the environment plays the most significant role in explaining variations in firm performance among the ESG dimensions, which is consistent with the results from the Random Forest model.
Further evaluation of the model's generalizability was conducted through 5-fold cross-validation, yielding an average RMSE of 0.0413 and a standard deviation of 0.0213, as shown in Table 3. This suggests that the model demonstrates strong predictive accuracy with minimal variability, indicating a stable generalization ability across the different folds.

Figure 6: Decision Tree Visualization of CatBoost Model
Table 2: Feature Importance of ESG Scores Across Models.
Model | Environment Score | Social Score | Governance Score |
Random Forest | 0.1543 | 0.1456 | 0.0978 |
XGBoost | 661.0 | 451.0 | 270.0 |
CatBoost | 11.45 | 6.29 | 10.84 |
Table 3: Cross-Validation Performance of Different Models.
Model | Mean RMSE | Standard Deviation |
Random Forest | 0.0532 | 0.0186 |
XGBoost | 0.0546 | 0.0217 |
CatBoost | 0.0413 | 0.0213 |
5. Conclusion and Future Direction
This study uses data from U.S. publicly listed companies in 2018 to analyze the relationship between ESG dimensions and corporate financial performance, with a particular focus on Return on Assets (ROA). Comprehensive analyses are conducted using linear models, Principal Component Analysis (PCA), and various machine learning models, including Random Forest and CatBoost. The findings are as follows:
In traditional linear regression models, the social dimension score has a significant positive impact on ROA, while the environment and governance dimensions show no statistical significance. This may be because ordinary least squares regression tends to capture significant linear relationships but is less effective at identifying nonlinear or interactive effects.
PCA reduces multicollinearity through dimensionality reduction and reveals the complex influence patterns of the environment and governance dimensions on financial performance. Specifically, the first principal component (PC1), which is primarily driven by the environment score, shows a positive impact on ROA, indicating that the environment dimension may indirectly enhance financial performance through overall ESG performance. In contrast, the second principal component (PC2), dominated by the governance score, has a negative impact on ROA, potentially reflecting the governance dimension's restrictive effects on financial performance in certain contexts. This suggests that the environment and governance dimensions may influence corporate performance through nonlinear or interaction effects.
The Random Forest model results indicate a strong nonlinear relationship between ESG practices and corporate financial performance. The Random Forest model demonstrates significantly higher accuracy in predicting ROA compared to the baseline linear regression model, further validating that traditional models may underestimate the complex roles of ESG dimensions. Variable importance analysis highlights that the environment dimension contributes the most to financial performance in the Random Forest model, which aligns with PCA findings regarding the dominance of the environment dimension.
The XGBoost model further reinforces the presence of nonlinear relationships between ESG dimensions and corporate financial performance, highlighting the dominant role of environmental factors in explaining variations in ROA. Similarly, the CatBoost model, with its optimized handling of categorical features and enhanced nonlinear fitting capability, further improves predictive performance while reaffirming the environment dimension as the most influential ESG factor. These findings align with the results of the Random Forest model, consistently emphasizing the critical impact of environmental factors on firm performance.
Overall, the study confirms the complex relationship between ESG practices and corporate financial performance, highlighting the critical role of the environment dimension in driving sustainable development and creating long-term value for firms. Moreover, the study demonstrates that machine learning techniques outperform traditional methods in capturing the nonlinear relationships between ESG and financial performance, providing valuable insights for companies to balance social responsibility and financial objectives in their strategic planning. Notably, the results consistently highlight that machine learning techniques emphasize environmental factors as the most influential ESG dimension, further reinforcing their critical role in shaping corporate financial outcomes.
This study opens up interesting questions that would be worth investigating for future research: First, this study mainly uses data from listed companies in the United States. Future research could expand to include different regions and countries to verify the generalizability and regional differences in the relationship between ESG and financial performance. Additionally, data with a longer time span and time series analysis could be incorporated to observe the long-term trends of ESG's impact. Second, this study uses ESG scores based on three dimensions, but specific indicators such as carbon emissions, employee satisfaction, and board structure may have more direct impacts. Future research could further refine these indicators. Furthermore, future research could explore the heterogeneous impacts of ESG practices on different types of companies, particularly focusing on differences in industries, size, and life cycle stages. This would promote the understanding of the specific mechanisms through which ESG affects various types of companies, providing theoretical support for developing more targeted corporate strategies. In addition, the impact of ESG may be moderated by specific policies (such as carbon taxes) or market environments (such as industry competition levels). Subsequent studies could incorporate relevant moderating variables and use causal inference tools to analyze how these external factors influence the relationship between ESG and corporate performance.


