


1. Introduction
In the realm of higher education, securing admission to prestigious graduate programs in today's world has become an increasingly competitive and challenging pursuit [1]. As aspiring scholars seek to secure their places in top-tier universities worldwide, a pressing question arises: What are the key factors that these esteemed institutions prioritize when evaluating prospective graduate students? This research paper examines various graduate program admission cases.
Traditionally, academic aptitude has been regarded as a fundamental criterion for graduate admissions. A candidate's academic performance in their chosen field of study, demonstrated through grade point average, standardized language test scores, and subject-specific knowledge, has long been considered the main indicator of evaluating applicants' suitability for advanced studies. These factors serve as tangible measures of an individual's capability to tackle the rigors of graduate-level coursework.
However, alongside academic proficiency, the importance of other factors—such as research experience, recommendation letters, and other qualitative measures—has increasingly gained recognition in the admissions process [2]. Top-tier institutions often prioritize applicants who have engaged in impactful research, published scholarly works, and garnered recommendations from respected figures within their academic discipline. These soft power indicators aim to gauge an applicant's potential for innovation, critical thinking, and contribution to their chosen field beyond academic performance alone.
It is worth exploring how the weighting of these various admission criteria may differ across institutions of different rankings and prestige. Do universities with higher global rankings place more emphasis on research experience and innovation, while prioritizing a candidate's potential to advance the frontiers of knowledge? Understanding these potential discrepancies is crucial for prospective graduate applicants, as it could impact their strategies for applying to different institutions and the overall success of their applications.
To shed light on these questions and concerns, this paper will utilize various machine learning models. By examining the various evaluation criteria employed by institutions of different tiers, this work aims to provide insights into the potential challenges that applicants may face when navigating the complex landscape of graduate admissions and shed light on the factors that can influence their chances of acceptance.
This study employs data visualization techniques to perform a comprehensive and insightful analysis of graduate applicants' profiles. Moreover, it compares the distinctive attributes exhibited by applicants from various tiers of educational institutions, shedding light on the nuanced differentiations among them. Various machine learning algorithms are also utilized, including multiple linear regression, K-nearest neighbors (KNN), decision trees, Bayesian classifiers, and support vector machines (SVM), to analyze graduate admissions data. These methods offer accurate predictions of admission likelihood and provide good interpretability, enabling a comprehensive understanding of the decision-making process in graduate admissions. Finally, this research paper critically examines the obtained findings and puts forth methodological strategies to derive more meaningful and robust conclusions from the presented results.
2. Method
2.1. Dataset
The dataset used in this research is obtained from Kaggle. It pertains to analyzing graduate admissions [3]. This dataset comprises variables representing students’ backgrounds, including GRE scores, TOEFL scores, Statements of Purpose (SOPs), Letters of Recommendation (LORs), Cumulative Grade Point Average (CGPA), research experience, and the probability of admission. It also considers the university ranking. The dataset includes a total of 400 entries, which have been sourced from the Internet. It can be used to examine the influence of numerous factors on graduate admissions, and the sample size of the dataset ensures the accuracy and reliability of the analysis.
2.2. Models
2.2.1. Multivariable linear regression. Multivariable linear regression is a useful to quantify the relationship between a dependent variable and more than one independent variables. The mathematical principle of multivariable linear regression entails finding the optimal fit line that minimizes the residual sum of squares between the predicted and actual values of the dependent variable. This is achieved by estimating the values of the regression coefficients, which encapsulate the slopes and intercept of the optimal fit line. Multivariable linear regression can handle extensive datasets and multiple independent variables flexibly, thus enabling the identification of the most significant predictors of the dependent variable [4]. However, multivariable linear regression presupposes that the relationship between the variables is linear, which may not always be the case, and it’s also sensitive to outliers and can be confounded by multicollinearity.
2.2.2. K-Nearest Neighbors. K-Nearest Neighbors (KNN) is widely used for its versatility and ease of implementation. The algorithm makes predictions based the on the nearest K neighbors. KNN doesn’t need any assumptions about the underlying distribution of the data. This is particularly useful when dealing with complex and high-dimensional data. Additionally, KNN is easy to interpret and can be applied to both classification and regression problems despite its computational complexity [5]. However, the performance of the algorithm depends on the choice of the k parameter and distance metric.
2.2.3. Decision tree. Decision Tree uses a hierarchical structure to model complex decision-making processes. Decision Tree uses entropy to maximize the amount of information gained at each level of the tree and recursively partition the data into subsets based on the values of the input features. Decision Tree is versatile in many domains due to its ability to handle both categorical and continuous data Decision Trees [6]. It also allows for interpretation of the decision-making process despite the potential risk of overfitting.
2.2.4. Bayes classifier. Bayes Classifier uses Bayes' theorem to make predictions [7]. The algorithm relies on the principle of conditional probability to estimate the probability of a class given the input features. The algorithm can incorporate prior knowledge about the class probabilities, which can improve its performance when the training data is limited [8]. However, Bayes relies on the assumption of independence between the input features and it needs accurate estimation of the class probabilities, which may be difficult in some scenarios.
2.2.5. Support vector machine. Support Vector Machine is known for its effectiveness in solving classification and regression problems. It doesn’t require assumptions about the underlying data distribution, making it suitable for handling complex and high-dimensional datasets [9]. This flexibility allows SVM to effectively capture intricate patterns and relationships within the data, even when the boundaries between classes are nonlinear or not well-defined. SVM exhibits excellent interpretability, as it constructs decision boundaries by maximizing the margin between different classes [10]. This characteristic enables a clear understanding of the classification process and the identification of influential features or support vectors that significantly impact the decision-making.
2.3. Evaluation metrics
Mean Squared Error (MSE) is calculated as the average of the squared differences between the predicted values and the actual values. The lower MSE values indicate better performance. The formula for MSE is:
\( MSE = \frac{1}{n}\sum _{i=1}^{n}{({y_{i}}-\hat{y})^{2}}\ \ \ (1) \)
where n is the number of samples, \( {y_{i}} \) is the actual value, and \( \hat{y} \) is the predicted value.
R squared is a metric to see how much of n of the dependent variable can be explained by the independent variables chosen. The value is between 0 and 1, with higher values indicating better performance. The formula for R-score is:
\( {R^{2}}=1-\frac{{SS_{res}}}{{SS_{tot}}}\ \ \ (2) \)
where \( {SS_{res}} \) is the sum of squared residuals and \( {SS_{tot}} \) is the total sum of squares.
Precision, Recall, F1-score are common evaluation metrics in accessing classification models, which are leveraged for measure the prediction performances.
3. Result
3.1. Statistical analysis
The mosaic plot depicted in Figure 1 illustrates the correlation among variables through color-coded representations. From the plot, it is evident that language scores exhibit a strong positive correlation with both GRE scores and CGPA, implying a significant association between language proficiency and academic performance.
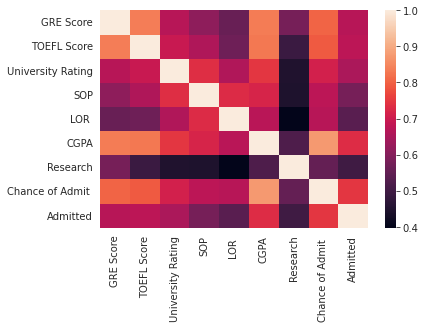
Figure 1. Variable correlations.
The comparative bar in Figure 2 reveals a significant association between research experience and the level of university applied to. Generally, there is a higher proportion of students with research experience among those who apply to higher-ranked universities. This observation suggests that universities with higher rankings place greater emphasis on applicants' comprehensive abilities, including research experience, indicating that higher-ranked institutions value a holistic skillset in their applicants.
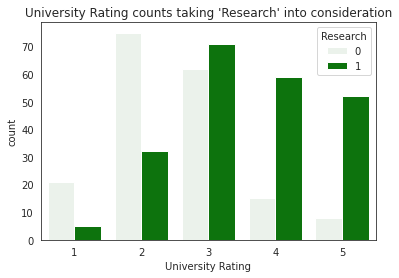
Figure 2. Relationship between university rating and research.
In order to visually demonstrate the impact of CGPA, TOEFL scores, and GRE scores on admission outcomes, as well as the influence of research experience on these outcomes, regression plots were employed for observation. From Figure 3, it can be seen that there’s a positive correlation between the aforementioned factors and admission outcomes, indicating that applicants with research experience generally have a higher likelihood of admission compared to those without. Furthermore, the influence of research experience is more pronounced among students with a high likelihood to be admitted than those who are less likely to be admitted.
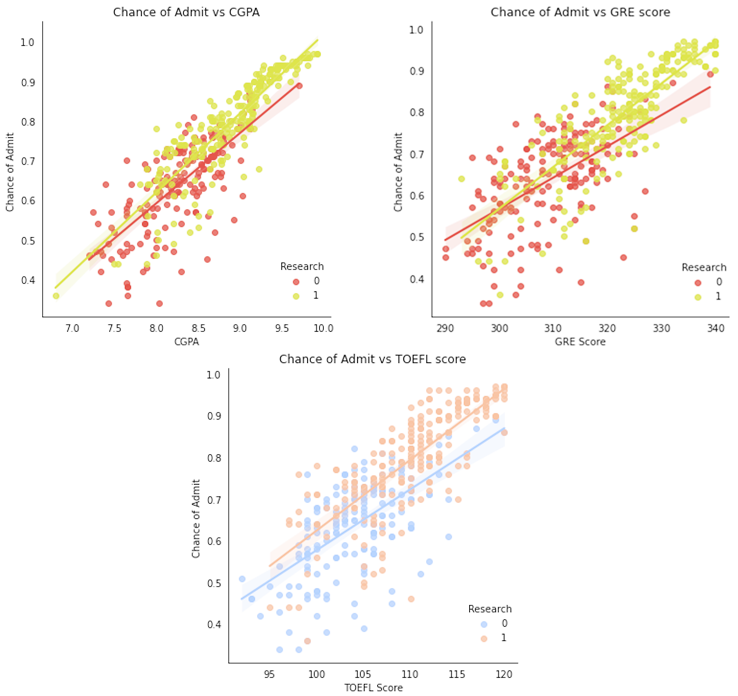
Figure 3. Impact of CGPA, TOEFL and GRE scores on admission.
3.2. Result of multivariable linear regression
Due to the standardization of the data, all variables are now on the same scale. The coefficients obtained from the multiple regression analysis reveal that indicators of students' academic and language abilities, such as GPA, GRE scores, and TOEFL scores, remain significant factors influencing admissions decisions. Additionally, it is evident that research experience also has a substantial impact on the admission outcome.
The predictive accuracy of multiple linear regression in estimating admission likelihood is observed to be relatively modest, achieving an accuracy rate of only 76%. This discrepancy suggests potential deviations from the linearity assumption inherent in multiple linear regression, implying the presence of nonlinearity within the dataset. Visual examination in Figure 4 demonstrates substantial disparities between predicted values and actual outcomes, particularly in cases where the actual admission likelihood is low. This observation leads to the speculation that candidates with lower probabilities of admission tend to exhibit comparatively weaker overall performance, thereby introducing a higher degree of stochasticity in the admission decisions. Consequently, the conventional application of linear regression may not be optimally suited for accurately predicting the admission likelihood of students characterized by low probabilities of acceptance.
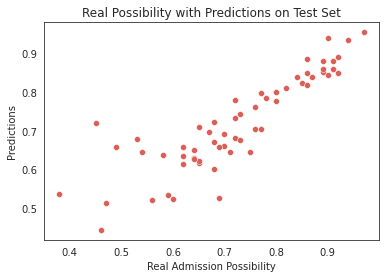
Figure 4. Predicted admission status leveraging multivariable linear regression.
3.3. Result of K-Nearest Neighbors
The variables of applicants were utilized as independent variables for the prediction of admission likelihood. To assess the predictive performance of the models, the entire dataset was subjected to k-fold cross-validation, with a random partitioning of 70% for training and 30% for testing. The models were trained using the training set.
Various values of the parameter K were enumerated, and the optimal K value with the lowest error on the test set was found to be 21. The model parameters were set accordingly to K=21. The results indicate that the model performed exceptionally well on the training set, achieving an R-squared value close to 1.0. However, on the test set, the model exhibited significant errors, with an R-squared value of only 0.78 and a mean squared error of 0.22. These findings suggest that the model performs well within the training set but exhibits substantial error when applied to the test set.
By applying the high-correlation filtering method, four variables with higher correlations were selected as independent variables to retrain the model. The comparation between real value and predicted value is shown in Figure 5. However, the results on the test set remained unchanged, with an R-squared value of 0.78. This outcome suggests that the lack of improvement may be attributed to an excessively large value for the parameter K, resulting in a model with low complexity and underfitting issues. Moreover, considering the significant variations in students' majors and individual characteristics, directly weighting the admission likelihood of similar students may not be reasonable. Therefore, the K-nearest neighbors (KNN) approach is not suitable for regression analysis of admission likelihood in the case of students.
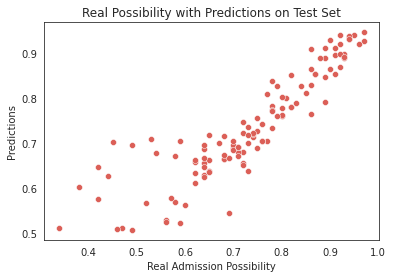
Figure 5. Prediction result of KNN.
3.4. Result of decision tree
The dataset was processed to facilitate the classification prediction of whether a student is likely to be admitted. Since 73% is the median of the distribution of chances of admission. Students with an admission likelihood exceeding 73% were categorized as having a high likelihood of admission, while those with a likelihood below 73% were classified as having a low likelihood of admission.
Next, the data was divided into training and test sets, and the optimal tree depth, where the model shows the lowest error on the test set, was determined as the depth for training the decision tree model. To visually identify the key factors influencing admissions decisions, the trained model was used to generate a graphical representation of the tree structure, shown in Figure 6. From the tree structure, it can be observed that the most crucial determinant for admissions is the cumulative grade point average (CGPA). When the CGPA exceeds 8.93, the likelihood of admission significantly increases. Additionally, for students with already high GPAs, the Graduate Record Examination (GRE) score serves as an important criterion, with scores above 319.5 indicating a higher chance of admission, provided strong recommendation letters are provided. In cases where language scores are not optimal, compelling personal statements can sometimes aid in the admission process. Furthermore, for students with lower GPAs, a significantly high GRE score (greater than 326) can improve the chances of admission. The decision tree model achieved a classification accuracy of 89%, indicating its effectiveness, although further improvements are needed due to the limited consideration of majors and undergraduate university backgrounds.
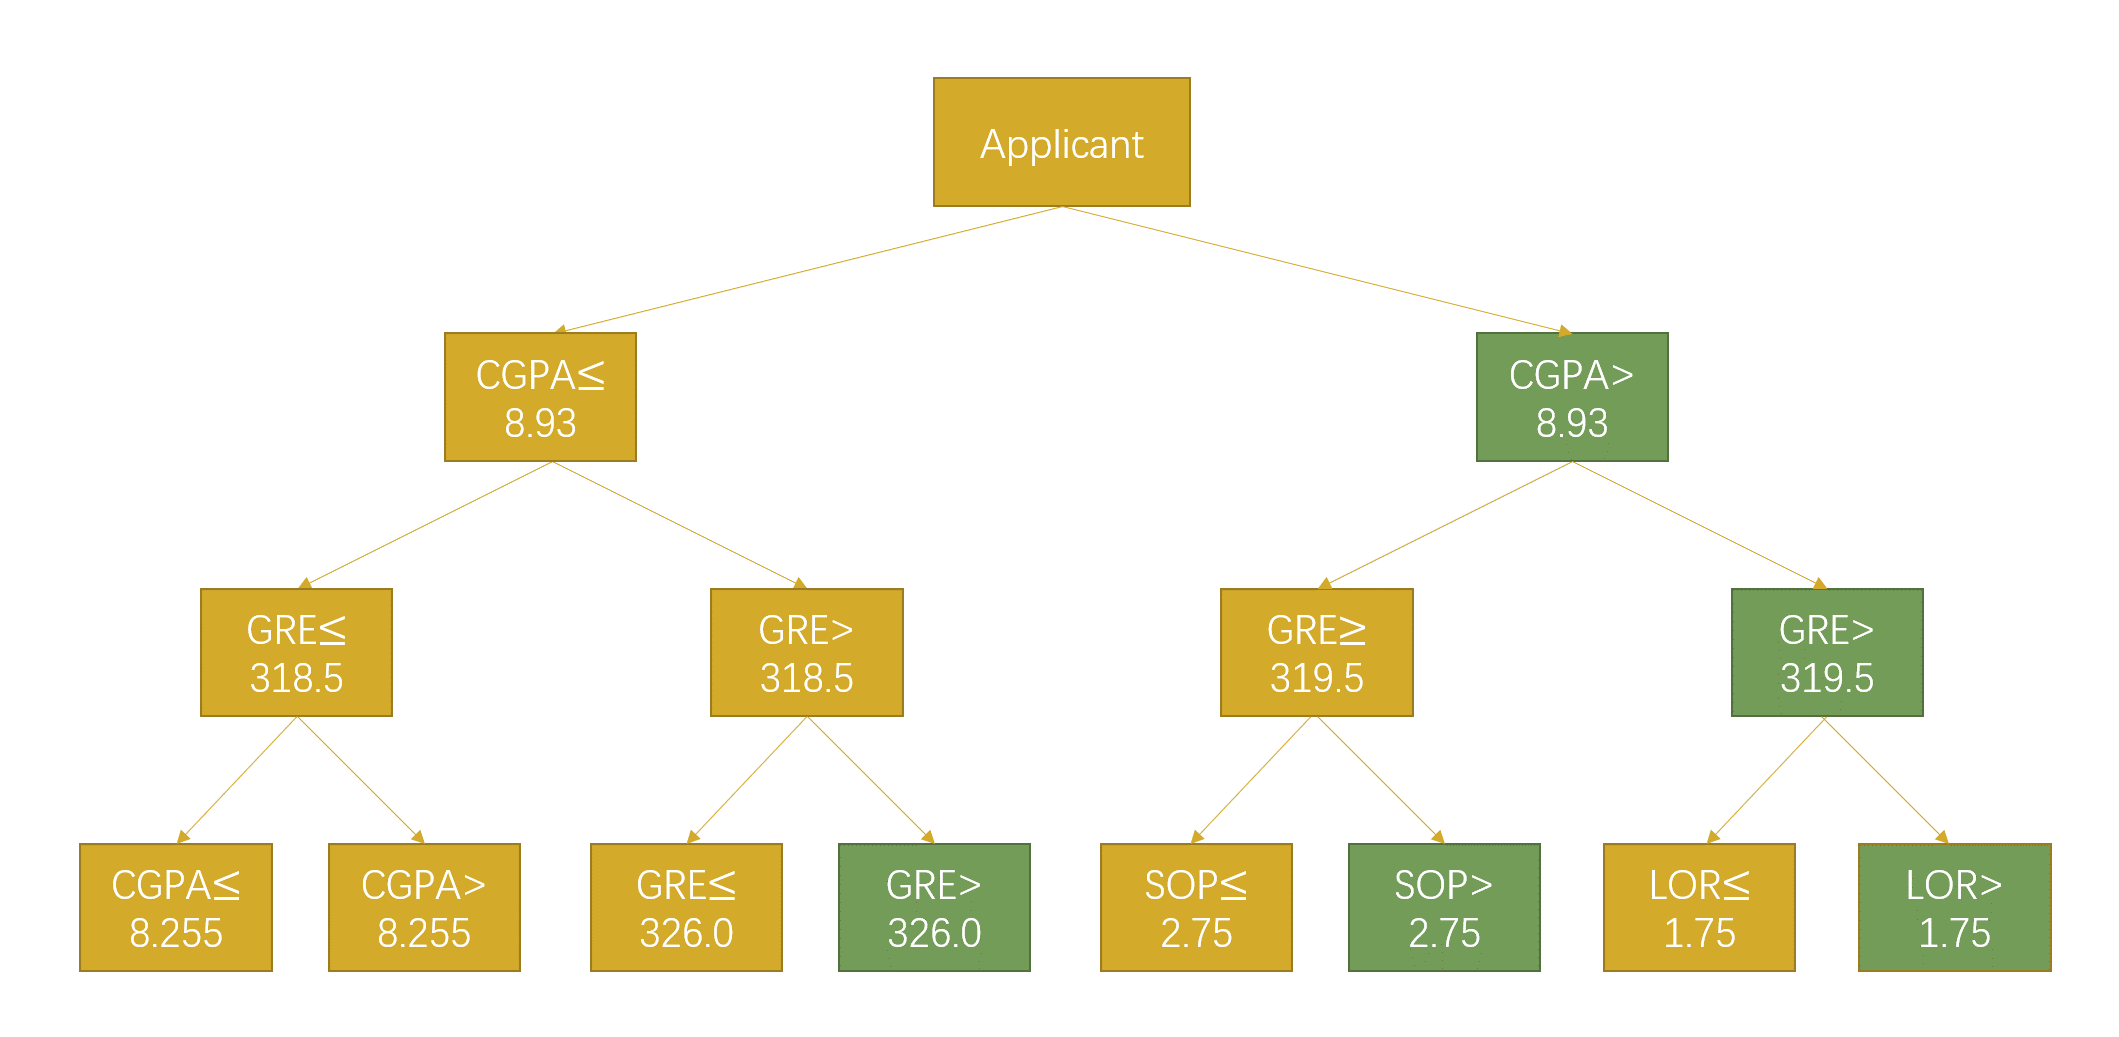
Figure 6. Structure of the trained decision tree.
3.5. Support vector machine
Support Vector Machine (SVM) is leveraged to classify graduate applicants into two categories: those with a higher likelihood of admission and those with a lower likelihood. The threshold for defining a higher likelihood was determined by the approximate value of the 75th percentile of admission probabilities, which was approximately 80%. The model was trained using 70% of the data from the k-fold cross-validation, the results can be seen in Table 1.
The results shown in Table 1 demonstrate a high overall accuracy of the classification predictions, reaching 98%. However, it is worth noting that the recall rate for students with a higher likelihood of admission is relatively low, indicating that there are instances where some high-likelihood applicants are incorrectly classified as having a lower likelihood of admission.
The coefficients of the hyperplane reveal that CGPA remains a critical factor in the discriminative power of the support vector machine. Additionally, the ranking of the applied universities and the presence of research experience are also identified as significant factors in the classification process.
Table 1. Result of SVM.
Precision | Recall | F1-score | |
High-Probability admission | 0.98 | 1.00 | 0.99 |
Low-Probability admission | 1.00 | 0.94 | 0.97 |
Accuracy | 0.98 | ||
Macro Avg | 0.99 | 0.97 | 0.98 |
Weighted Avg | 0.98 | 0.98 | 0.98 |
3.6. Bayes classifier
Finally, in this study, a Bayesian classifier was employed to infer the likelihood of graduate admission for applicants based on prior distributions. The results, as shown in Table 2, indicate that the accuracy of the model is relatively high accuracy, reaching 97%. However, it was observed that some students with low admission likelihood were misclassified as having a high likelihood. This discrepancy may be attributed to the influence of extreme prior cases.
Table 2. Result of Bayes classifier.
Precision | Recall | F1-score | |
High-Probability admission | 1.00 | 0.95 | 0.98 |
Low-Probability admission | 0.90 | 1.00 | 0.95 |
Accuracy | 0.97 | ||
Macro Avg | 0.95 | 0.98 | 0.96 |
Weighted Avg | 0.97 | 0.97 | 0.97 |
4. Discussion
The results obtained in this study indicate that despite the increasing competitiveness in graduate admissions and the growing significance of research and other skills, core academic abilities reflected in overall GPA, GRE scores, and language proficiency remain crucial factors influencing the admission process. Moreover, higher-ranked universities not only have higher expectations for academic aptitude but also place greater emphasis on assessing applicants' research potential, as evidenced by their emphasis on research experience. Additionally, the intense competition among top-tier institutions may contribute to this trend, as it becomes challenging for applicants to differentiate themselves solely based on core academic abilities. Therefore, applicants strive to showcase their research potential through relevant experiences.
However, the accuracy of predictive models still falls short. One potential factor contributing to this limitation is the omission of the applicants' intended field of study and undergraduate institution in the analysis. Furthermore, certain variables, such as research experience, were dichotomously categorized, which may not capture the nuanced aspects of research quality and academic capabilities. Future studies could consider incorporating more comprehensive variables to enhance the accuracy and precision of the models. Additionally, the dataset is in as small scale with only 400 applicants' data, which may have impacted the model's generalizability and predictive performance.
5. Conclusion
With the application of machine learning models, the study has shown that the applicants' academic performance and language proficiency affect the admission results significantly. It has been observed that the abilities pertaining to learning and language continue to play a significant role in determining admissions outcomes. Moreover, the findings indicate that higher-ranked universities tend to place greater emphasis on research experience when evaluating applicants. For individuals whose academic abilities are not exceptionally strong, enhancing their language proficiency can significantly improve their chances of securing admission. The study provides valuable insights and guidance for prospective graduate applicants. In an increasingly competitive environment, applicants need to focus on enhancing their soft skills, but it is equally crucial for them to prioritize their academic proficiency and language abilities as these factors emerge as the key determinants of admissions outcomes. When all academic abilities reach a high level, soft skills can serve as additional advantages, further enhancing their competitiveness. It is therefore imperative for applicants to strive for excellence in both academic and language domains, recognizing their significance in the admissions process. By understanding these dynamics, applicants can effectively plan and strategize their efforts to maximize their chances of successful admission.
This study serves as a precedent example for future research endeavors that aim to employ machine learning models for predictive purposes. Furthermore, it reaffirms the critical role of academic aptitude in the admissions process and finds the relationship between research experience and the university rate. Nonetheless, it is important to note that the study's models exhibited a limitation in terms of their overall accuracy. Future research could potentially address this limitation by considering additional factors such as the applicants' undergraduate institutions and by refining the indicators used to assess the factors such as research experience, thereby enhancing the predictive capabilities.