


1. Introduction
425 million people worldwide have diabetes in 2017, referring to the International Diabetes Federation (IDF); this number is projected to increase to 642 million by 2040. Diabetes is one of the four major killers of human health and has more than 160 complications, including heart disease and hypertension, making it one of the biggest global human health crises of the twenty-first century [1]. A series of complications caused by this lifelong disease is the primary reason behind patients' deaths, accounting for more than 40% of the composition of disease deaths in the population and posing a great threat to human health [2].
Therefore, it is particularly important to construct efficient diabetes diagnosis models and actively promote them to achieve early disease risk prediction for diabetic patients and reduce complications caused by diabetes to improve the informed and confirmed rate of diabetes.
Data mining to analyze and predict the risk of diabetes based on different individual characteristics is important for the health of the public and the early diagnosis of diabetes patients. On the one hand, the use of model analysis and comparison to find the best model prediction effect has made a certain theoretical and contribution to future research on diabetes and related diseases. In addition, early and correct diagnosis of diabetes can lead to earlier treatment time and reduce the high mortality rate caused by diabetic complications, and at the same time, effective risk assessment of individuals for diabetes can screen the potentially affected population and make prevention by timely adjustment of lifestyle habits [2].
In this paper, we will specifically study the application method and future prospects of the KNN algorithm in predicting the probability of diabetes, which is also important for the development of related medical fields.
2. Research design
2.1. Data collection
The dataset used in this paper was derived from the UCI Machine Learning Repository's Pima Indian Diabetes Dataset. The National Institute of Diabetes and Digestive and Kidney Diseases (NIDDK) provided this dataset at first. The dataset's objective is to determine through diagnostic prediction whether a patient has diabetes using some of the diagnostic measures it contains [3].
There are 768 samples in the dataset overall, and there are 8 characteristic attributes and 1 label variable, and the meanings of the 8 characteristic attributes are shown in Table 1.
Table 1. Description of the Pima Indian Diabetes Dataset.
Property Number | Attribute Abbreviation | Attribute Detail Description |
1 | Pregnancies | Number of pregnancies |
2 | Glucose | Plasma glucose concentration after two hours in an internal glucose tolerance test |
3 | DBP/mmHg | Diastolic blood pressure |
4 | TSFT/mm | Triceps skinfold thickness |
5 | INS/(μU/ml) | 2-hour serum insulin |
6 | BMI/(kg/ \( {m^{2}} \) ) | Body mass index |
7 | DPF(Diabetes Pedigree Function) | Family history of diabetes |
8 | Age | Age |
9 | DM | 0 means no diabetes, 1 for diabetic |
Table 2 displays the partial data set following collation.
2.2. Data analysis
By statistical analysis, the total number of samples with label values of 0 was 268 (34.9% of the total sample), and the number of samples with label values of 1 was 500 (65.1% of the total sample).
The analysis of the characteristic correlations showed that the correlation between diabetes (Outcome) and Blood pressure and Diabetes Pedigree Function was weak, and the number of Pregnancies, Skin Thickness, and Insulin all correlated well. The correlations with the number of Pregnancies, Skin Thickness and Insulin were positive, and the correlations with blood glucose (Glucose) and body mass index (BMI) were stronger.
In addition, there were strong correlations between the number of Pregnancies and Age, Glucose and Insulin, and Skin Thickness and body mass index (BMI).
Analysis of the distribution of diabetes by age yielded the following results.
90 diabetic and 327 non-diabetic patients in the age group 21-30; 76 diabetic and 71 non-diabetic patients in the age group 31-40; 64 diabetic and 49 non-diabetic patients in the age group 41-50; 31 diabetic and 23 non-diabetic patients in the age group 51-60; and 7 diabetic and 20 non-diabetic patients in the age group 61-81.
According to the prevalence rate of each age group, it can be seen that the prevalence of diabetes is mostly concentrated between 31 and 60 years old. According to the results of the survey, the age of diabetes mellitus in China is about 59 years old or older, and it can be seen that the age of diabetes mellitus is getting younger and younger as the living standard is improving.
3. Model construction and analysis of results
3.1. Algorithm selection and model building
In this project, 768 sample data from the Pima Indian diabetes dataset were collected for diabetes prediction, which is a small computational volume and a binary classification problem. The KNN algorithm's computational complexity scales with the amount of samples in the set used for training, and it is sufficiently low to fulfill the project's need for the classification and prediction of diabetes patients.
Euclidean distance is used in the KNN algorithm, and the formula for calculating the Euclidean distance between two points in a multidimensional space [4] is as follows.
\( d(x,y)=\sqrt[]{{({x_{1}}-{y_{1}})^{2}}+{({x_{2}}-{y_{2}})^{2}}+…+{({x_{n}}-{y_{n}})^{2}}}=\sqrt[]{\sum _{i=1}^{n}{({x_{i}}-{y_{i}})^{2}}} \) (1)
3.1.1. Selection of K values. The variance was calculated by splitting the training set and the data set based on 8:2 for the Pima Indian diabetes dataset and performing cross-validation to obtain the variance as shown below in Figure 1:
| |
Figure 1. K values and corresponding error rates. | |
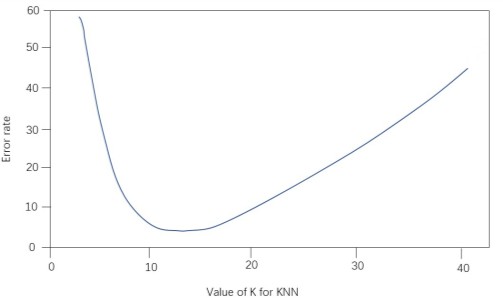
The above figure shows the relationship between the model prediction accuracy (y-axis) and the number of nearest neighbors (x-axis) for the training and test sets. From the figure, we can get that the best solution is to choose 11 nearest neighbors, i.e., K=11.
3.1.2. Vector normalization. Due to the large data differences between different features of the data set, which will affect the weights for the KNN algorithm, the data are processed using linear function normalization, with the following normalization formula.
\( {x^{,}}=\frac{x-{x_{min}}}{{x_{max}}-{x_{min}}} \) (2)
where \( {x^{,}} \) is the normalized data, \( x \) is the original data, and \( t \) he original data set's maximum and minimum values are represented by the variables \( {x_{max}} \) and \( {x_{min}} \) . Normalizing the data can make the data distribution more standardized, speed up the optimal solution, and improve the prediction accuracy.
3.1.3. Prediction model building. After splitting the training set of 614 cases and the test set of 154 cases according to the ratio of 80% and 20%, the KNN model is built using the K values determined above and the data set obtained after normalization.
Next, for any new sample, it is classified as the one with the most categories among the K samples closest to that sample. This project is a binary classification problem: it is known that the sample where are the sample points, indicating the category to which the sample belongs (c1, c2 corresponds to whether the sample has diabetes or not). For a new sample x, the classification y of this sample can be solved by the following equation.
\( y={argmax_{{c_{j}}}}\sum _{({x_{i}},{y_{i}})∈{N_{k}}(x)}{f_{{c_{j}}}}({y_{i}}) \) (3)
\( {f_{{c_{j}}}}({y_{i}})=\begin{cases} \begin{array}{c} 1, {y_{i}}={c_{j}} \\ 0,{y_{i}}≠{c_{j}} \end{array} \end{cases} \) (4)
Where \( {N_{k}}(x) \) denotes the set of K samples closest to sample x and f is the model about \( {y_{i}} \) .
3.2. Analysis of results
3.2.1. Calculation of performance indexes. The confusion matrix of the test sample was calculated, and from the confusion matrix, it can be seen that there were 125 cases of non-diabetes predicted as non-diabetes in the test set, i.e., TN=125; 1 case of diabetes predicted as diabetes, i.e., TP=1; 2 cases of non-diabetes predicted as diabetes, i.e., FP=2; and 26 cases of diabetes predicted as non-diabetes, i.e., FN=26.
The evaluation indexes and calculation methods are shown in Table 3[5].
Table 3. Evaluation indexes and calculation methods.
Evaluation index Calculation method | Evaluation index Calculation method |
Accuracy | \( \frac{TP+TN}{TP+TN+FP+FN} \) |
Precision | \( \frac{TP}{TP+FP} \) |
Recall | \( \frac{TP}{TP+FN} \) |
F1-score | \( \frac{2*Precision*Recall}{Precision+Recall} \) |
The performance evaluation metric values of the diabetes prediction model are shown in Table 4.
Table 4. Calculation results of evaluation index values.
Indicator Name | Accuracy | F1-score |
Calculated value | 0.818 | 0.667 |
The experimental findings illustrate the model's high accuracy and thorough coverage for the sample data on diabetes prediction, with the KNN algorithm having a high accuracy of 81.8% in diabetes prediction classification and an F1-score of 66.7%.
4. Conclusion
The research work on diabetes prediction in this paper has achieved certain results:
Linear function normalization was used to process the data, turning the dimensional expressions into dimensionless expressions, making the data distribution more standardized, finding the optimal solution faster, and improving the prediction accuracy. The confusion matrix of the test samples was also calculated to solve the values of each evaluation index of the model, and the excellent performance of this algorithm was verified. Also, the sample data from the experimental cases is of high quality, and the features are filtered, which is important in predicting the probability of diabetes [6].
However, there is still room for improvement in this paper, and future research can be improved in the following aspects.
The main reason for the good results of the KNN algorithm in this project is the high quality of the case sample data and the screening of the features; however, the small sample size and the relatively large number of features in the case data have a negative impact on the results. Furthermore, the dataset used in this project is from the United States, so this model may be less accurate when used for classification prediction of diabetes data from other countries.
In this paper, the open diabetes dataset was selected for modeling. The number of datasets is limited due to time and other factors, so it may lead to model limitations when constructing the model. The prediction model can be optimized by selecting a large-scale medical dataset in subsequent research work.
The current research related to deep learning is developing rapidly, and in terms of prediction, the KNN algorithm is slow, so the use of deep learning algorithms to improve the diabetes prediction model is considered in the later research, thus improving the function of the model and its prediction efficiency, which helps to improve the accuracy of classification prediction.