


1. Introduction
Machine learning is a kind of artificial intelligence that is typically used by software applications to become more accurate at data prediction [1]. Machine learning algorithms are the algorithms to build models. Those models are based on the sample data, which also known as training data [2]. With these models, people are able to predict results without asking the computer scientist to create specific program. Providing a real data that never used before to the models allows the algorithm to generate certain results. Different machine learning algorithms make prediction using different strategy [3]. With that reason, using the same sample data could lead to different prediction result. This paper focuses on comparing the performance of three machine learning algorithms: K-nearest neighbors’ algorithm, Random Forest algorithm, and Support vector machine algorithm [4-6]. With different model behavior, algorithms will result in different predictions. Adjusting the hyperparameters could increase the prediction accuracy. Therefore, it is important for us to find out which algorithm is best for the corresponding dataset. This paper will summarize each algorithm’s characteristics.
Previous paper mostly focusses on talking about the comparison of machine learning algorithms over the disease’s prediction. This paper instead will also address the prediction of other aspect. Author will be checking the prediction result of survivor in Titanic database using these three algorithms. Using the Kaggle scoring system, author will be comparing and analysis the training accuracy, validation accuracy, and Kaggle accuracy. In addition to that, author will also be checking the effects that hyperparameters of each algorithms brings. Section 2 of the paper will be focusing on how K-nearest neighbors’ algorithm, Random Forest algorithm, and Support vector machine algorithm creating models individually. Section 3 describes the adjustment of hyperparameters of these three algorithms. Section 4 evaluates and compares the results over the accuracy. Section 5 is the conclusion.
2. Creating Models using Machine Learning Algorithms
When dealing with data prediction, creating a model for the specific dataset is usually the first step. Each classification follows their own rule to create and achieve the model. The below subsections will be talking about each algorithm individually by first introducing the algorithm and then explain how it is used for predicting the survivors of the Titanic database.
In order to keep the unity of the predictions and get a more accurate data, features “Ticket”, “Name”, “SibSp”, “Parch”, and “Cabin” are dropped from the dataset. Since some of the features have vacant values, null is filled to make sure learner can work successfully. For the “Embarked” feature, ‘S’ that appears most frequently among its three gears is used to fill the void.
2.1. K-nearest neighbours
K-nearest neighbors algorithm is a method that used for regression and classification. The K-nearest neighbors classifier assign the unlabelled observations using the labels that are most similar to them [1]. In order to achieve that, the characteristics of the observations are collected during the model formation. K value represents the number of nearest neighbors been used during the prediction process. For example, when k = 1, only one neighbor will be chosen, and the unlabelled value will be assigned the same value as the neighbor value. For the Titanic database, KNeighborsClassifier from sklearn in python is used to implement the KNN model. With the library, model is built automatically by calling the function.
2.2. Random forest
Random forest algorithm is also a method that used for both regression and classification. The unlabelled value is assigned by the value selected by most tress. Different part of the database is trained by multiple decision trees. The random forest collects all the trees and thus form a forest to reducing the variance and improving the overall performance. Similar to the K-nearest neighbours algorithms, random forest algorithm also involving weighting neighbour values [2].
For the Titanic database, Random Forest Classifier from sklearn in python is used to implement the random forest model. With the library, model is built automatically by calling the function.
2.3. Support vector machine
At last, support vector machine algorithm usually stands for a supervised learning algorithm that used for both classification and regression analysis. Observations from the data set are separated into two categories and each value is assigned into one of them. The observations are trained in order to get a maximum width for gap between two categories. The support vector machine model would assign the unlabelled value by using an unsupervised learning approach. The value is mapped into the formed group.
For the Titanic database, SVC model from sklearn in python is used to implement the support vector machine model. The support vector clustering algorithm is used. Similar to the above two algorithms, the model data is trained and predicted by calling the function from the library.
3. Adjustment of Hyperparameters
Each algorithm creates a comparative low score with implementing and adjusting hyperparameters. After computing gradSearchCV for k-nearest neighbours’ algorithm, random forest algorithm, and support vector machine algorithm, the prediction accuracy for all the algorithms increased significantly. The below subsections provide a concreate example for each algorithm to show how the hyperparameters is used when predicting the survivor in the Titanic database.
3.1. K-nearest neighbours
The K-nearest neighbours’ algorithm itself provide a sufficient result. Adjusting the k value for the specific dataset is the most important step for the data prediction. For the Titanic database, the accuracy score with different k values is implemented [7]. In order to find the best k value, the below figure provides an intuitive comparison.
|
Figure 1. Comparison of different k values. (Photo credit: original) |
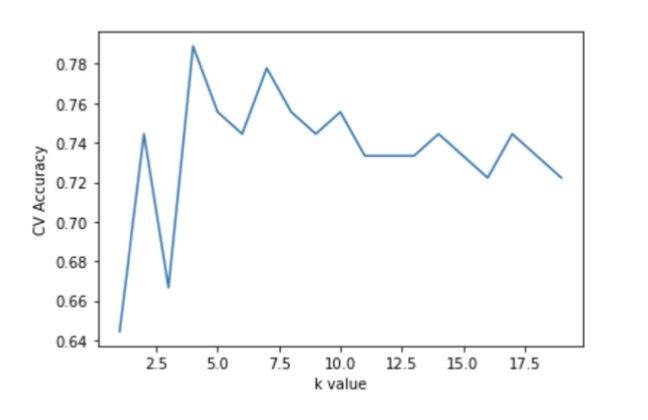
As shown in the above figure, different k values lead to different accuracy. A k value of 4 leads to the relatively higher accuracy. Plugging that value into the code lead us to a result of 0.76 in terms of the Kaggle score accuracy.
3.2. Random forest
Since the random forest model contains multiple parameters, it is hard to compute each combination and show them in a figure like what this paper did for the K-nearest neighbors’ algorithms [8-10]. Thus, this paper chooses to implement the GridsearchCV to indentify the optimal parameters for the random forest model. For the Titanic dataset, the graid parameters was set for main_samples_leaf [1, 3, 5], min_samples_split [2, 4, 6], and n_estinators [50, 150, 400, 650]. Using the training data, the above combination provides the best results. The interval is restively small due to the time limitation. After training the model for 5 times, the optimal solution is min_samples_leaf = 1, min_samples_split = 6, and n_estinators = 400. After plugging the hyperparameters into our model, this paper gets a score of around 0.79, which is slightly higher than what this paper gets before implement the hyperparameters.
3.3. Support vector machine
Similar to the random forest algorithm, support vector machine model also contains multiple parameters. Implementing the GridSearchCV from sklearn in python is also important to tune the model in order to find the best hyperparameters. Support vector machine models contains both c value intervals and gamma intervals. Iterate both values are also time consuming. After iterating the model five times with a c value interval of [1, 2, 5, 10, 20, 50, 100], this paper can select the best value for c which is 50 with an accuracy of 0.82. That also lead us to a higher Kaggle score accuracy than what this paper had before adjusting the hyperparameters.
4. Evaluation and Comparison
It can be told from the above approach that models usually produce a better performance after adjusting the hyperparameters. Using the Titanic dataset, this paper is able to summarize a performance table 1 with all the results for K-nearest neighbors’ algorithm, random forest algorithm, and support vector machine algorithm.
Table 1. Accuracy performance summarize table.
Training Accuracy | Validation Accuracy | Kaggle Accuracy | |||
K-nearest neighbours | 0.7928 | 0.7835 | 0.7584 | ||
Random forest | 0.8311 | 0.7932 | 0.7703 | ||
Support vector machine | 0.8217 | 0.8111 | 0.7751 |
As shown in the above table, it can be told that the Support vector machine algorithm is achieving a higher accuracy score in both training accuracy, validation accuracy, and Kaggle accuracy for the survivor prediction for Titanic database. Without considering the time consuming, support vector machine algorithm led to the best result. Combining the adjustment process this paper did above, support vector machine algorithm produced a comparatively high score on the model using sklearn.svm before implementing the gradSearchCV to compute the hyperparameter.K-nearest neighbors algorithm produced a restively lower score. The training accuracy, validation accuracy, and Kaggle accuracy of K-nearest neighbors’ algorithm are all around 0.01 – 0.03 lower than the two other machine learning algorithms. From the observations and experiment process, this paper can tell that it is because for the limited parameter this paper can adjust for the K-nearest neighbors’ algorithm. The only thing this paper changed for the KNN model is the k value.However, the random forest algorithm with most adjustable parameters did not produce the best result. When implementing the gradSearchCV for random forest model, this paper kept the intervals relatively small in order to save the running time. It could be said that if this paper is able to give bigger intervals when tuning the model, random forest algorithm may lead to a better result.
The performance accuracy isn’t the only factor to determine which algorithm is the best. When tuning the support vector machine algorithm, this paper only iterates through the c value and ignore the gamma value to save the running time. For the random forest algorithm mentioned above, this paper also limited the intervals of the hyperparameters. The algorithm that took the least time is the K-nearest neighbors’ algorithm. Predicting with different k values is restively fast. Thus, this paper could predict that more adjustable hyperparameters lead to more accurate results but takes longer time to run.
5. Conclusion
From the above comparison, this paper can see that K-nearest neighbor algorithm provide us with fastest result. It contains only one adjustable parameter, which is the k value. Printing out the predict accuracy with different k values provide us a clear result of which one is better. The random forest algorithm contains the most hyperparameters to adjust. In the above comparison, GridSearchCV takes a long time to run and a requires a good computer, this paper limited the interval input thus did not produce the best result. Support vector machine algorithm provide us with the best result before adjustment. After using the GridSearchCV, this paper is able to find the best hyperparameters for the support vector machine algorithm. It could be predicted that given a good computer and enough time, random forest algorithm could give us the best result.
With the comparison result, this paper is able to find the best algorithm for Titanic dataset. In addition, this paper is able to conclude that algorithm with more hyperparameters could produce more accurate result. Those models can have better prediction over the database. However, when apply the algorithm into the real-world prediction, the prediction quality is not the only factor to consider. Find the best hyperparameters requires good amount of time to tune the model. Thus, the result could be applied with more considerations.
This paper only focuses on the result based in Titanic database. In the future, it is important for us to compare the results over other dataset. In addition, K-nearest neighbors’ algorithm, Random Forest algorithm, and Support vector machine algorithm cannot represent all the machine learning algorithm. In the future findings, this paper would like to add more algorithms to compare. That could include ensembled algorithm which combine many machine learning algorithms together to create a unique model. That could lead to a more accurate result.