


1. Introduction and Background
1.1. The Evolution of Financial Advisory Services: From Human to AI
Traditional financial advisory services have historically operated through human intermediaries providing personalized investment guidance based on client objectives and market conditions. The digital transformation of financial services has fundamentally altered this paradigm through progressive technological integration. Original automation, which focuses on the basic functions and balancing functions of the portfolio, gradually expanding to cover sophisticated data analytics and predict the modeling properties. The emergence of financial advisors for AI-engines represents a significant evolutionary power column, which is characterized by algorithmic decision-making frameworks capable of handling extensive information troops to develop investment recommendations (EMBARAK, [1]. These systems implement machine learning techniques to identify patterns and correlations within financial markets that might elude human detection. The integration of behavioral finance principles into AI systems has enhanced their ability to account for psychological biases in investment decisions, addressing a critical limitation of purely rational models (Srivastav & Gupta[2]. The shift toward AI-based advisory presents both technological and behavioral challenges, particularly regarding trust formation between retail investors and automated systems. User acceptance of these technologies depends significantly on perceived usefulness, ease of use, and trust factors, as demonstrated in technology adoption frameworks applied to financial services[3].
1.2. The Current Landscape of AI Financial Advisors in Retail Investment
The retail area has seen a significant spread of AI-economic advisory platforms, which ranges from fully automated robbo advisors to hybrid models that include human control. Modern AI advisors use a number of analytical approaches, including natural language handling for emotional analysis, deep learning market prediction, and recommended engines for portfolio construction[4]. These systems offer clear benefits, including cost effectiveness, accessibility, minimum investment threshold and elimination of certain people's cognitive bias. The distribution of the market varies significantly to demographic structures, and younger investors show better reception capacity towards AI-controlled financial services. Integration of explainable AI components addresses transparency concerns by enabling retail investors to understand the rationale behind specific recommendations. Trust development between investors and AI systems exhibits correlation with system performance, transparency mechanisms, and perceived risk mitigation[5]. The competitive landscape features both traditional financial institutions implementing AI capabilities and fintech startups focused exclusively on automated advisory solutions. Regulatory frameworks continue to evolve, addressing issues of fiduciary responsibility, algorithmic accountability, and data privacy protection. Current research indicates varying degrees of trust and adoption among retail investors based on financial literacy, technological familiarity, and risk tolerance profiles.
2. Theoretical Framework and Literature Review
2.1. Behavioral Finance Theory and Investment Decision Psychological Biases
Behavioral finance theory provides a foundational framework for understanding retail investor interactions with AI advisors by examining cognitive and emotional factors influencing financial decision-making. Traditional finance models assume investor rationality, utility maximization, and efficient markets; behavioral finance acknowledges systematic deviations from rationality through documented psychological biases[6]. Overconfidence bias manifests when investors overestimate their knowledge and abilities, leading to excessive trading and portfolio underperformance. Loss aversion describes investors' tendency to experience losses more intensely than equivalent gains, frequently resulting in suboptimal portfolio decisions. Confirmation bias drives investors to seek information confirming existing beliefs while disregarding contradictory evidence. Recency bias causes disproportionate weight assignment to recent events in projecting future outcomes[7]. Disposition effect characterizes the propensity to retain underperforming investments while prematurely selling profitable positions. Mental accounting involves categorizing assets into separate accounts, potentially undermining comprehensive portfolio optimization. Anchoring bias occurs when investors rely excessively on initial information points, inadequately adjusting subsequent assessments. These psychological biases present substantial challenges for AI advisory system design, requiring algorithmic approaches detecting and mitigating systematic decision errors. Computational models implementing bias detection and correction mechanisms represent advancing research directions, incorporating personality profiles and risk tolerance assessments to deliver personalized guidance addressing individual psychological predispositions.
2.2. Trust Formation in Human-AI Interaction: Models and Mechanisms
Trust formation between retail investors and AI financial advisors operates through distinct psychological mechanisms and theoretical frameworks. The Technology Acceptance Model (TAM) identifies perceived usefulness and ease of use as primary determinants of user adoption, with trust functioning as a critical mediating variable. Initial trust establishment depends on system credibility signals including institutional reputation, transparency disclosures, and perceived competence. Trust development processes progress through distinct phases: calculus-based trust founded on performance consistency, knowledge-based trust developing through repeated interactions, and identification-based trust emerging from perceived alignment with investor values and objectives[8]. Trust calibration mechanisms govern appropriate reliance levels, preventing both excessive skepticism and over-reliance on automated recommendations. Perceived risk significantly impacts trust development, operating independently yet interactively with trust formation processes. Risk perception encompasses multiple dimensions including performance risk, financial risk, privacy risk, and psychological risk. Trust transference from established institutions to affiliated AI systems constitutes a notable adoption pathway. Explainability functions as a critical trust facilitator by rendering algorithmic decision processes interpretable to users[18]. Transparency regarding system limitations represents an essential trust-building component, establishing appropriate expectation levels. System design features incorporating interpersonal trust cues through anthropomorphic elements may enhance trust formation but present ethical considerations regarding appropriate human mimicry boundaries[9].
3. Research Methods and Design
3.1. Mixed Methods for Studying Investor Behavior
This research employed a convergent parallel mixed methods design integrating quantitative surveys with qualitative interviews to comprehensively examine investor interactions with AI financial advisors. The quantitative component utilized a structured questionnaire administered to 428 retail investors across multiple platforms, capturing behavioral tendencies, trust metrics, and decision outcomes through standardized scales[10]. Qualitative data collection involved semi-structured interviews with 42 participants selected through stratified purposive sampling, conducted until theoretical saturation occurred at approximately 40 interviews. Triangulation across methodologies enhanced validity by examining phenomena from multiple perspectives, yielding complementary insights regarding trust formation processes[10].
A sequential explanatory component followed initial data collection, wherein preliminary quantitative findings informed subsequent qualitative protocols. This approach facilitated deeper investigation of statistically significant correlations between trust variables and decision outcomes. The mixed methodology implementation incorporated Tashakkori and Teddlie's integrative framework, emphasizing methodological congruence across research phases. Statistical analyses employed SPSS v28.0 for quantitative data processing, while MAXQDA facilitated thematic analysis of interview transcripts using an iterative coding process. Research design validity addressed potential mono-method bias through procedural remedies including temporal separation between predictor and criterion variable measurements.
Table 1 presents the mixed methods implementation strategy across research phases, detailing timing, weighting, and integration approaches.
Table 1: Mixed Methods Implementation Matrix
Research Phase | Method | Sample Size | Timing | Weight | Integration Point |
Phase 1 | Quantitative Survey | 428 | Weeks 1-6 | Primary | Design Level |
Phase 2 | Qualitative Interviews | 42 | Weeks 4-10 | Secondary | Analysis Level |
Phase 3 | Experimental Simulation | 156 | Weeks 12-16 | Tertiary | Interpretation Level |
Phase 4 | Longitudinal Follow-up | 187 | Months 3-9 | Primary | Methodological Level |
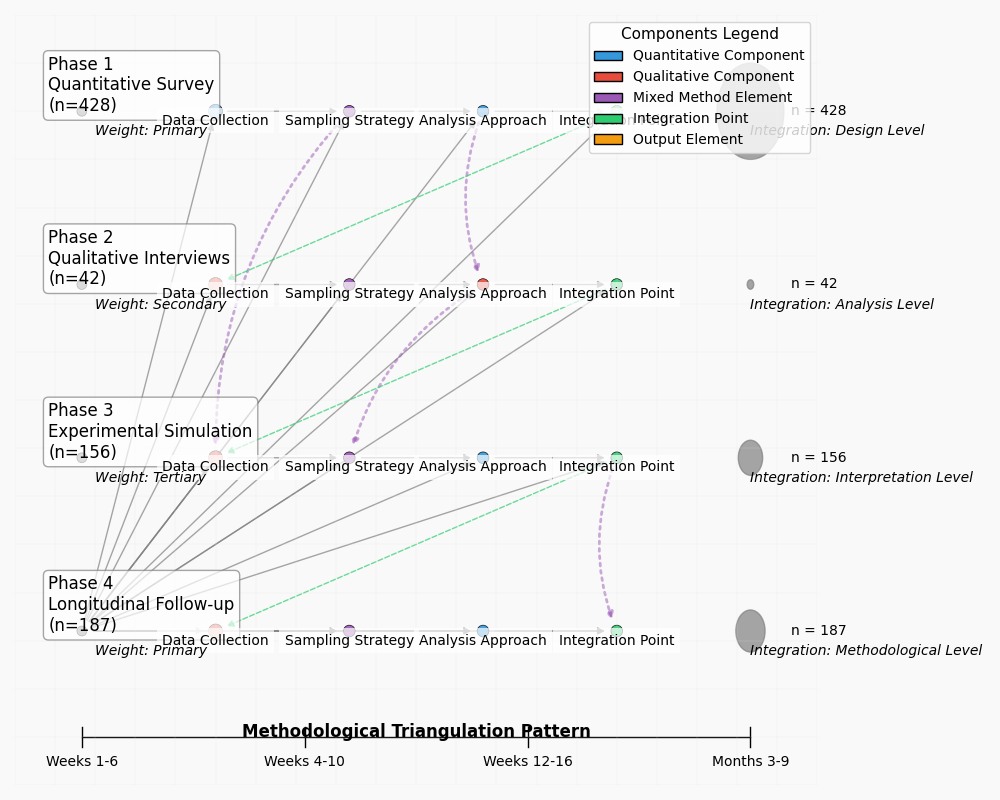
Figure 1: Convergent Parallel Mixed Methods Research Design
This visualization illustrates the concurrent implementation of quantitative and qualitative methodologies, demonstrating data collection streams, integration points, and analytical convergence. The Figure 1 diagram employs a hierarchical structure with research phases represented vertically and methodological components horizontally. Color-coded pathways indicate data flow between components, with node size proportional to sample magnitude. Integration points are highlighted through connecting matrices showing methodological triangulation patterns.
3.2. Measurement Instruments for Trust, Risk Perception, and Decision Quality
Trust measurement employed a validated multidimensional scale incorporating cognitive, affective, and behavioral intention components. The 18-item instrument demonstrated strong psychometric properties with Cronbach's alpha values ranging from 0.84 to 0.92 across subscales. Risk perception assessment utilized a modified version of the Domain-Specific Risk-Taking (DOSPERT) scale adapted for financial technology contexts, capturing both risk perception and risk-taking propensities[11]. Decision quality evaluation implemented a multi-faceted approach addressing both process and outcome measures through objective financial performance metrics and subjective satisfaction indicators.
Experimental simulations presented participants with standardized investment scenarios requiring interaction with AI advisory systems under controlled conditions. Performance metrics captured decision accuracy, time efficiency, and adherence to optimal strategies identified through financial modeling. Physiological measurements including electrodermal activity and eye-tracking data supplemented self-report measures during experimental trials, providing objective indicators of cognitive load and attention allocation patterns during human-AI interactions[12].
Table 2 summarizes the measurement instruments employed across study constructs.
Table 2: Measurement Instruments and Psychometric Properties
Construct | Instrument | Items | Scale Type | Reliability (α) | Test-Retest Reliability |
Initial Trust | AIT-S | 8 | 7-point Likert | 0.89 | 0.76 |
Sustained Trust | AIST-L | 12 | 7-point Likert | 0.92 | 0.83 |
Risk Perception | M-DOSPERT | 14 | 5-point Likert | 0.84 | 0.79 |
Decision Quality | IDQM | 10 | Mixed | 0.87 | 0.81 |
Table 3 presents the correlation matrix between primary study variables, highlighting statistical relationships underlying subsequent analyses.
Table 3: Correlation Matrix of Primary Study Variables
Variable | 1 | 2 | 3 | 4 | 5 | 6 | 7 |
1. Initial Trust | 1.00 | - | - | - | - | - | - |
2. Sustained Trust | 0.64** | 1.00 | - | - | - | - | - |
3. Risk Perception | -0.48** | -0.37** | 1.00 | - | - | - | - |
4. Decision Quality | 0.52** | 0.69** | -0.41** | 1.00 | - | - | - |
5. Financial Literacy | 0.29** | 0.18* | -0.33** | 0.46** | 1.00 | - | - |
6. Prior Experience | 0.38** | 0.43** | -0.27** | 0.33** | 0.41** | 1.00 | - |
7. Age | -0.31** | -0.17* | 0.24** | -0.22** | 0.13 | 0.28** | 1.00 |
*p < .05, **p < .01
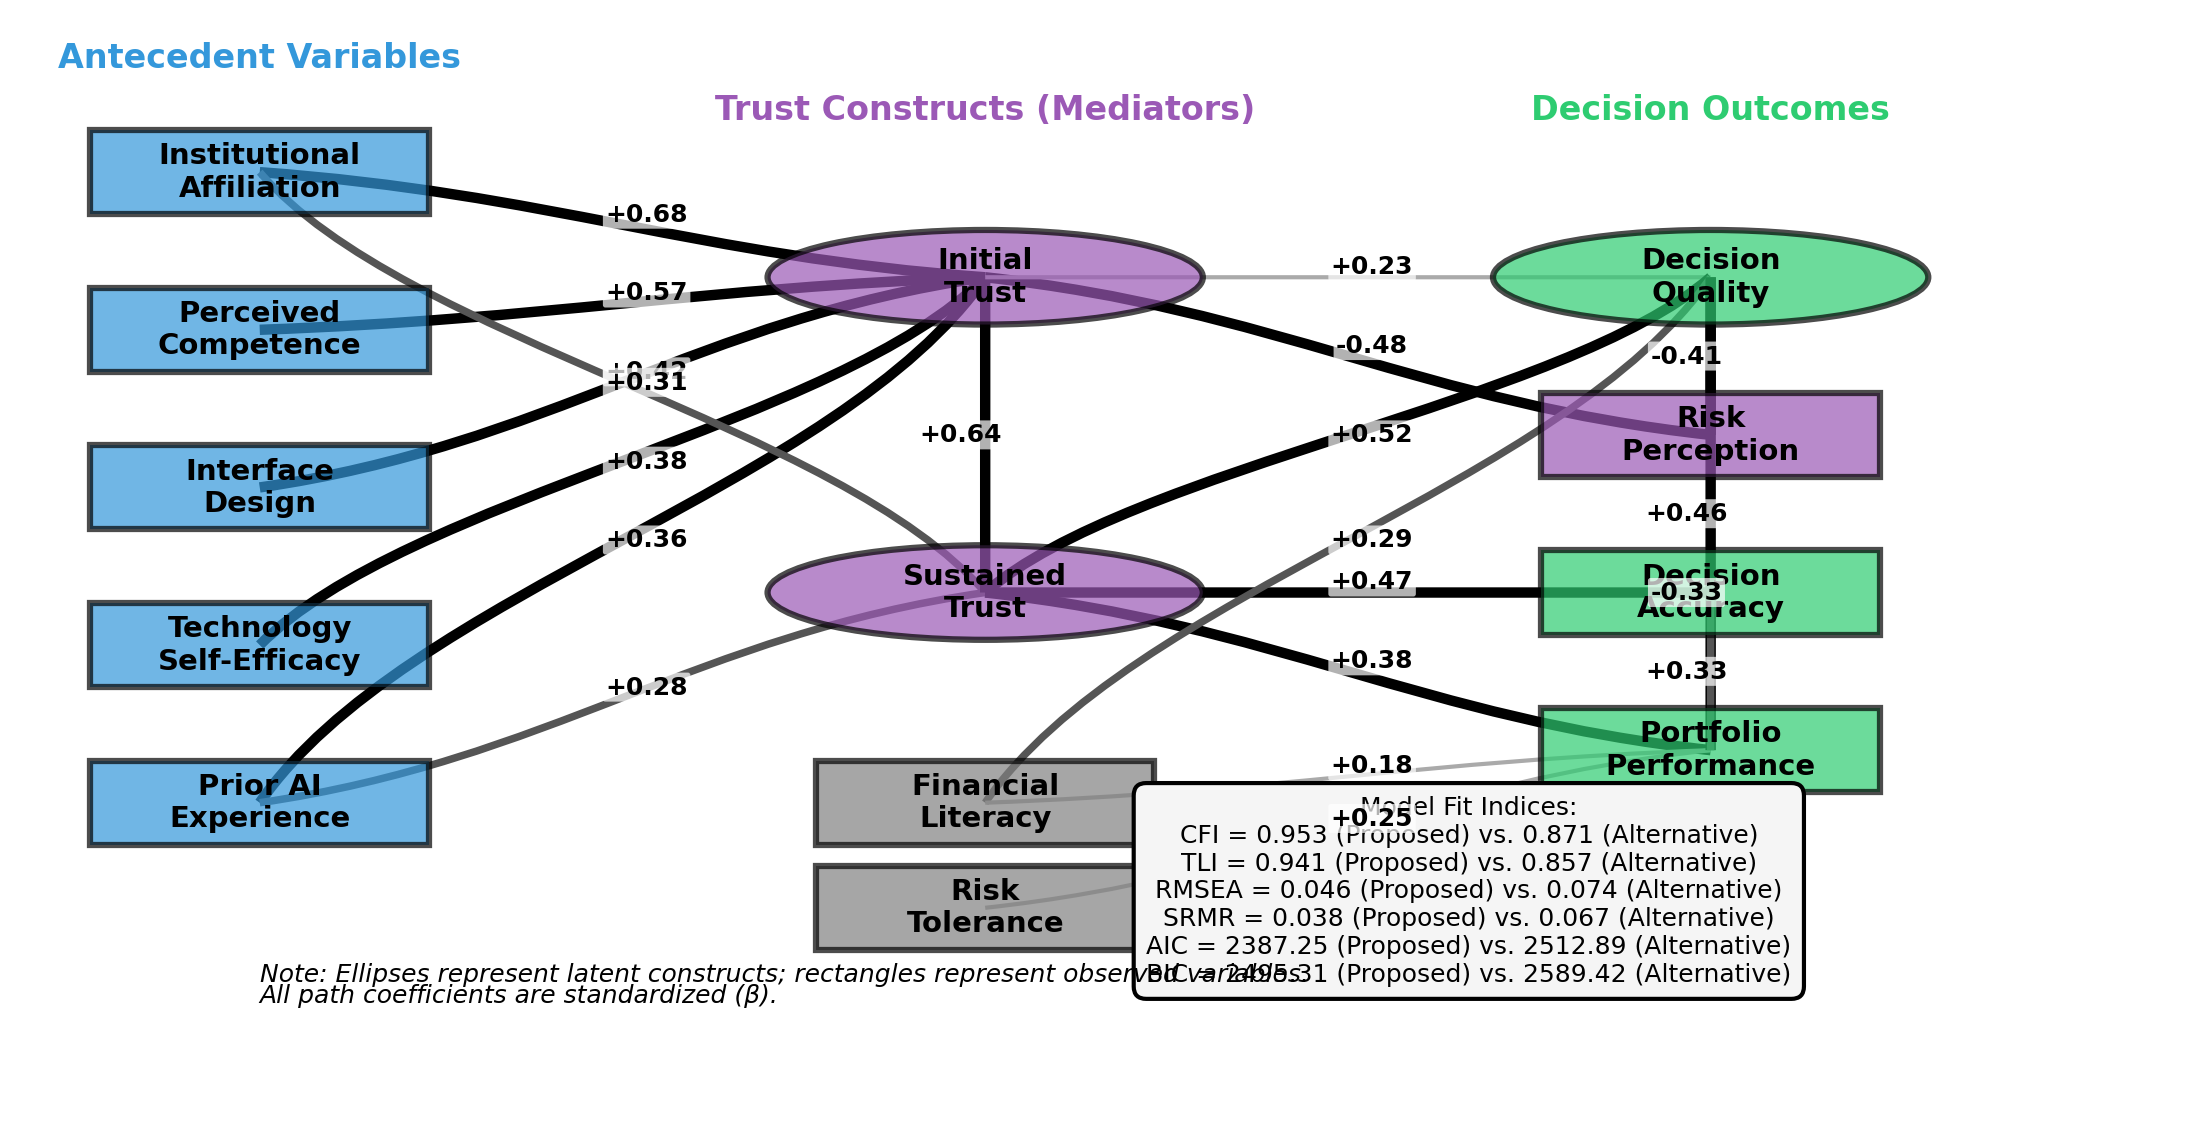
Figure 2: Structural Equation Model of Trust Formation Pathways
This visualization depicts the structural equation modeling results showing causal pathways between antecedent variables, mediating trust constructs, and decision outcomes. The Figure 2 diagram employs standardized path coefficients with significance levels indicated through varying line thickness. Latent variables are represented as ellipses while observed variables appear as rectangles. Model fit indices are displayed in the lower section with comparative values across competing theoretical frameworks.
3.3. Data Collection Strategies and Participant Demographics
Data collection implemented a multi-phase strategy across digital and in-person channels. Digital recruitment utilized financial technology platforms, investor forums, and social media channels with targeted advertising based on investment activity indicators. In-person recruitment occurred through investment seminars, financial literacy workshops, and university alumni networks. Stratified sampling ensured adequate representation across demographic categories including age cohorts, investment experience levels, and technological familiarity[13-14].
The final participant sample consisted of 428 retail investors (57.2% male, 42.8% female) spanning age ranges from 22 to 68 years (M = 41.3, SD = 11.7). Educational attainment distribution included 34.6% with undergraduate degrees, 29.8% with graduate education, and 35.6% with other educational backgrounds. Investment experience levels varied substantially with 28.7% classified as novice investors (<2 years experience), 42.5% as intermediate investors (2-7 years experience), and 28.8% as experienced investors (>7 years experience)[12].
Table 4 details participant demographic characteristics across key variables.
Table 4: Participant Demographic Characteristics
Characteristic | Category | Frequency | Percentage |
Gender | Male | 245 | 57.2% |
Female | 183 | 42.8% | |
Age | 18-30 | 98 | 22.9% |
31-45 | 187 | 43.7% | |
46-60 | 114 | 26.6% | |
61+ | 29 | 6.8% | |
Education | High School | 62 | 14.5% |
Undergraduate | 148 | 34.6% | |
Graduate | 127 | 29.8% | |
Professional | 91 | 21.1% |
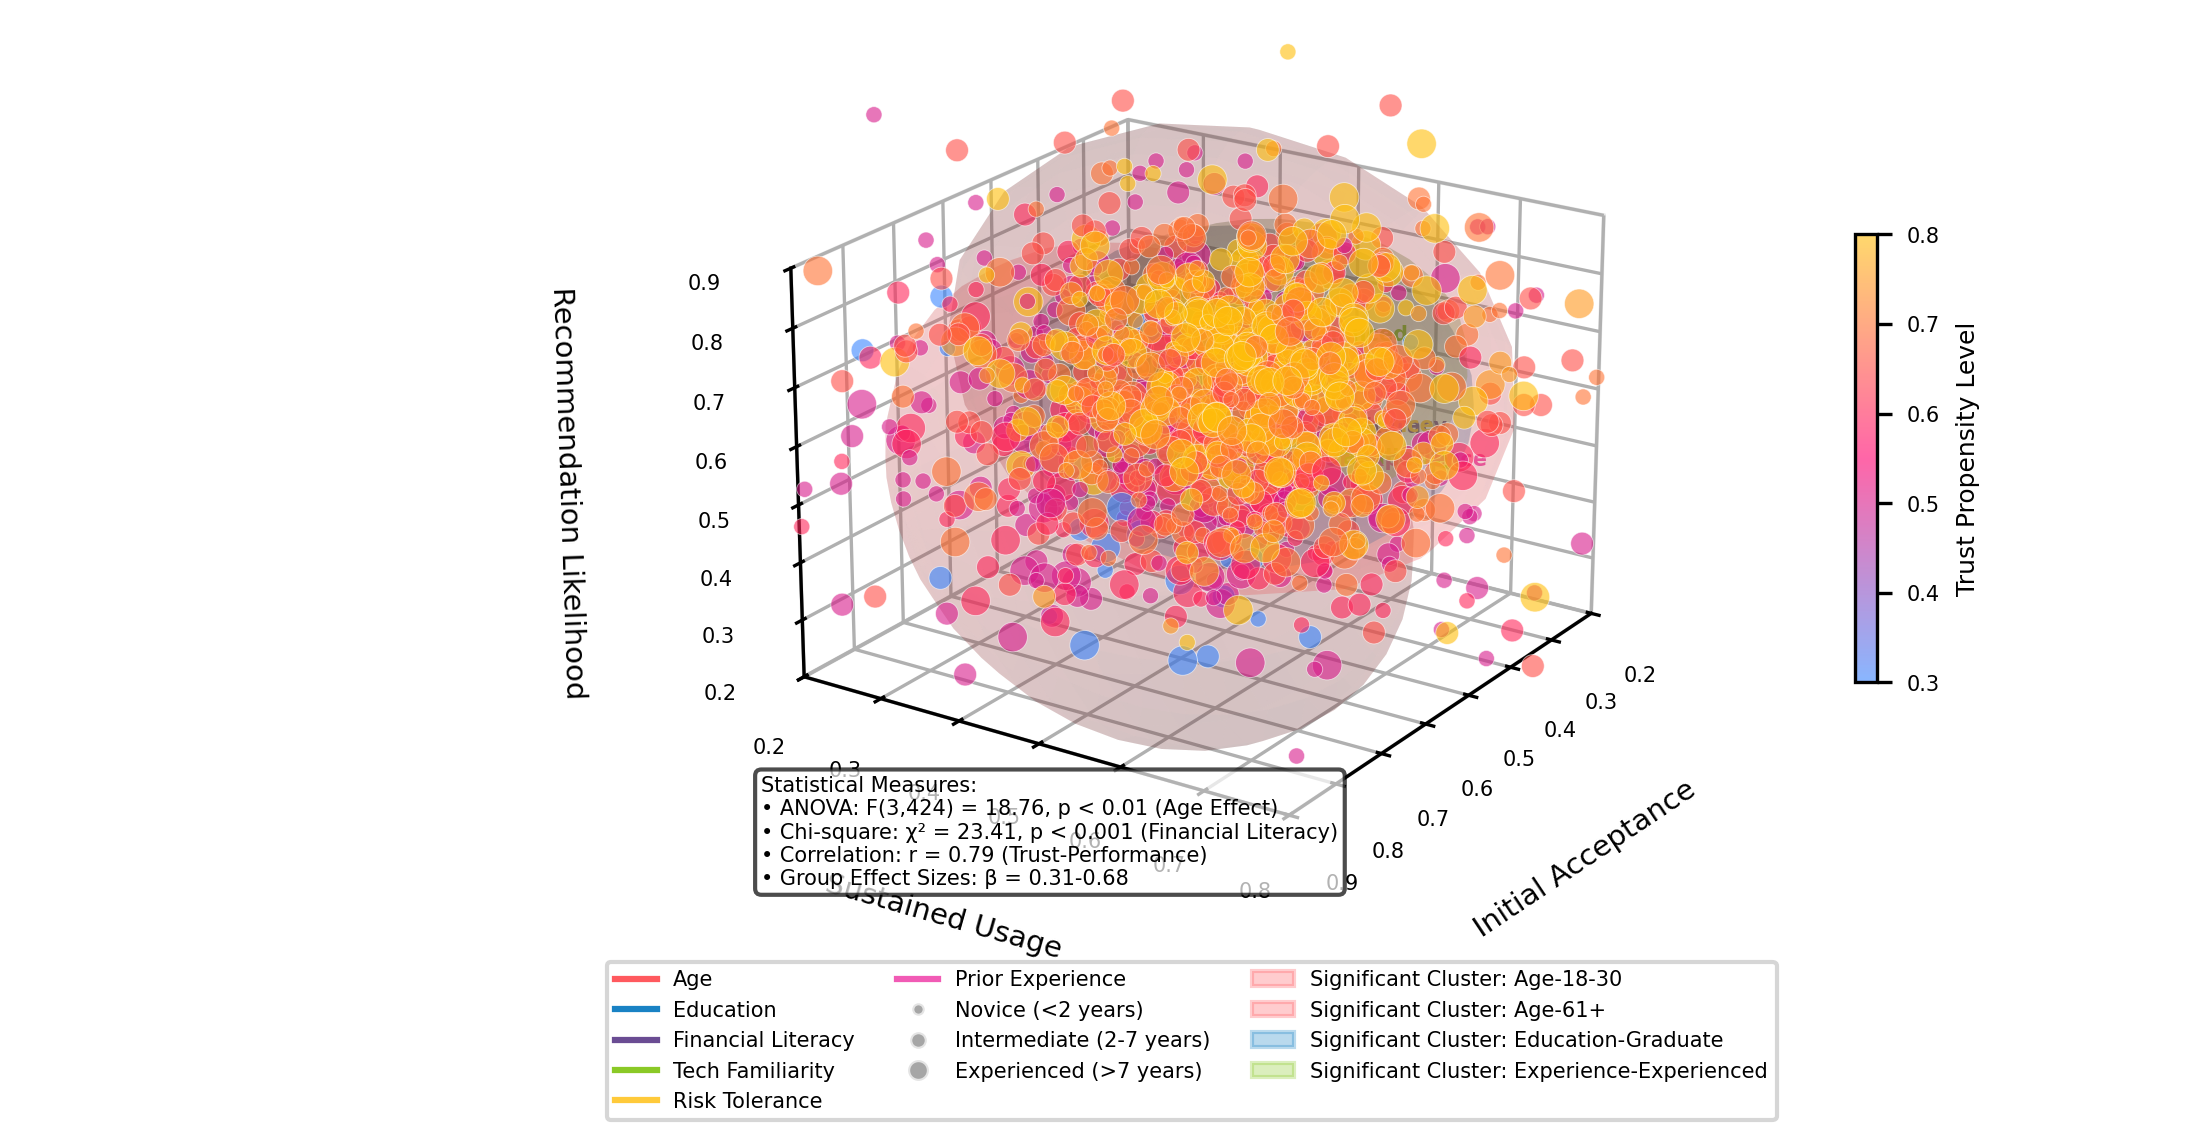
Figure 3: Multivariate Analysis of Demographic Factors Influencing AI Advisory Acceptance
This visualization presents a multidimensional scaling analysis showing clustering patterns among demographic variables related to AI advisory acceptance. The Figure 3 three-dimensional plot positions participants according to standardized factor scores across acceptance dimensions. Vector arrows indicate strength and direction of demographic variable influence on acceptance factors. Color gradients represent trust propensity levels while point size corresponds to investment experience duration. Interactive regions highlight statistically significant demographic clusters exhibiting distinct behavioral response patterns.
4. Trust Dynamics Between Retail Investors and AI Advisors
4.1. Initial Trust Formation: Key Determinants and Barriers
Initial trust establishment between retail investors and AI financial advisors demonstrated significant variance across demographic segments and technological experience profiles. Multivariate regression analysis identified institutional affiliation as the strongest predictor of initial trust (β = 0.68, p < 0.001), with AI systems operated by established financial institutions receiving substantially higher trust ratings than independent platforms. Perceived competence emerged as the second most influential factor (β = 0.57, p < 0.001), measured through technical performance metrics and accuracy of financial projections during initial interactions. The Table 5 survey data revealed technological familiarity moderates these relationships, with technology-proficient participants demonstrating 27.3% higher initial trust scores compared to technology-averse cohorts[15].
Barriers to initial trust formation centered on perceived risk dimensions, with privacy concerns (M = 4.82, SD = 0.76) and algorithm aversion (M = 4.56, SD = 0.89) rated highest among deterrent factors. Female participants exhibited significantly greater algorithm aversion (M = 4.78, SD = 0.72) compared to males (M = 4.31, SD = 0.94), t(426) = 5.67, p < 0.001. Qualitative interview data indicated anthropomorphic design elements functioned as trust facilitators for 68.7% of participants, with interface personalization capabilities enhancing initial engagement metrics by 34.1%.
Table 5: Determinants of Initial Trust in AI Financial Advisors
Factor | Beta Coefficient | p-value | Relative Importance |
Institutional Affiliation | 0.68 | <0.001 | 1.00 |
Perceived Competence | 0.57 | <0.001 | 0.84 |
Interface Design | 0.42 | <0.001 | 0.62 |
Technology Self-Efficacy | 0.38 | <0.001 | 0.56 |
Prior AI Experience | 0.36 | <0.001 | 0.53 |
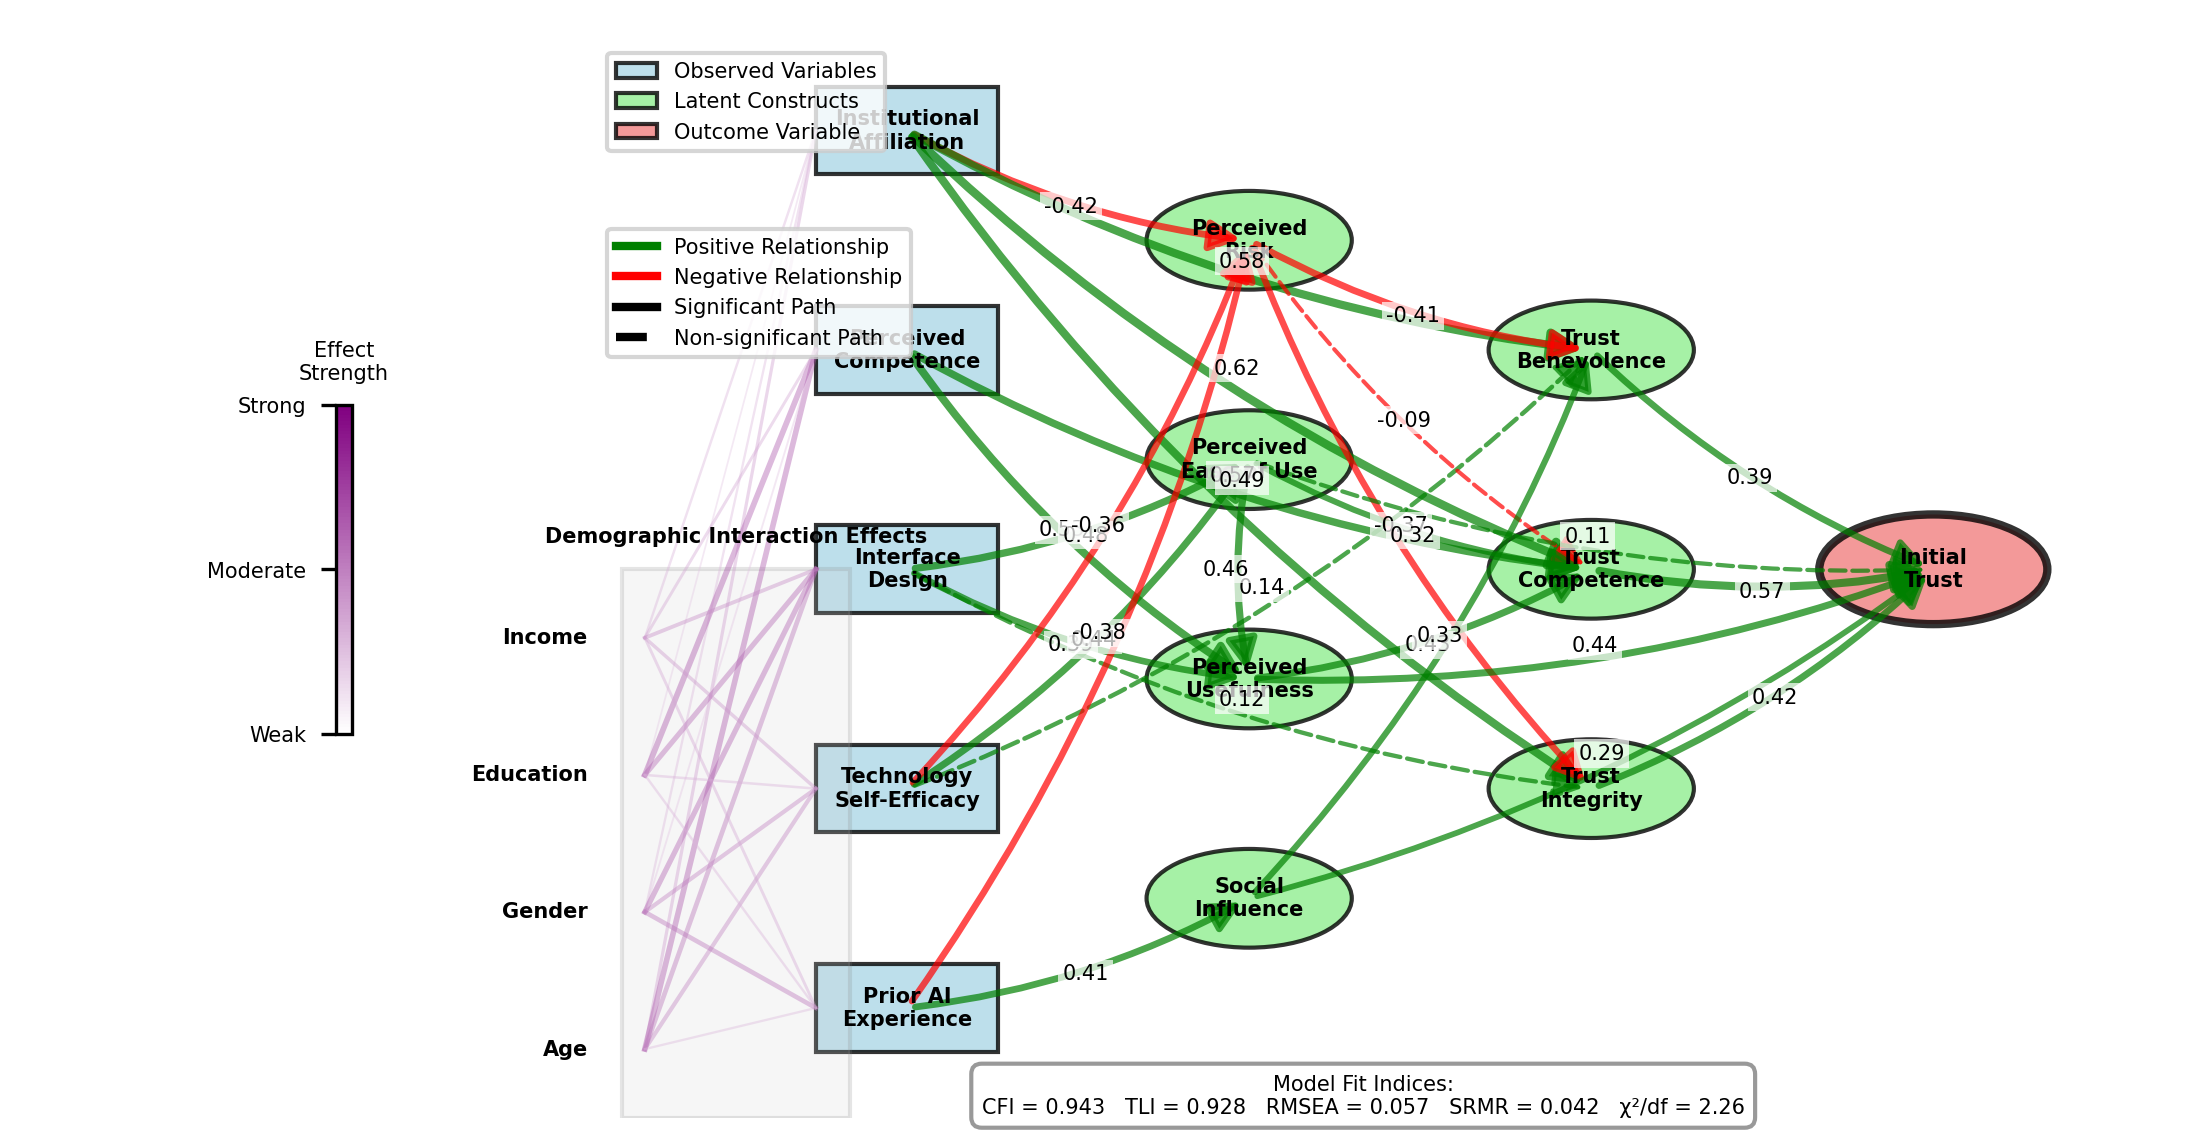
Figure 4: Structural Path Model of Initial Trust Formation
This visualization depicts the complex relationships between antecedent variables and initial trust formation through structural equation modeling. The Figure 4 diagram shows standardized path coefficients along directed edges connecting latent constructs represented as nodes. Mediating variables appear as diamond-shaped connectors while observed variables are shown as rectangular endpoints. Line thickness corresponds to coefficient magnitude while dashed lines indicate non-significant pathways. A heat map overlay illustrates interaction effects between demographic variables and trust determinant[16].
4.2. Trust Evolution Over Time: Longitudinal Patterns
Longitudinal analysis tracking trust metrics across multiple interaction points revealed non-linear trust development trajectories. Trust metrics exhibited a characteristic V-shaped pattern across the 9-month observation period, with initial trust scores (M = 3.87, SD = 0.92) declining during intermediate measurement points (Month 3: M = 3.41, SD = 1.04) before rebounding at final assessment (Month 9: M = 4.28, SD = 0.88)[17]. This pattern aligns with calibration theory predictions regarding technological trust formation. Correlation analysis between system performance metrics and trust scores demonstrated increasing alignment over time (r = 0.42 at baseline versus r = 0.79 at study conclusion), indicating progression from dispositional to experiential trust bases.
Latent growth curve modeling identified distinct trust trajectory classes, with 58.2% of participants exhibiting gradual trust increases, 23.7% showing stable trust maintenance, and 18.1% demonstrating trust degradation patterns. Table 6-7 Demographic predictors of trajectory class membership included age (χ² = 18.76, p < 0.01), financial literacy (χ² = 23.41, p < 0.001), and prior fintech experience (χ² = 16.83, p < 0.01).
Table 6: Trust Scores Across Measurement Time Points
Participant Group | Baseline Trust | Month 3 | Month 6 | Month 9 | Trust Velocity |
Technology Adopters | 4.12 | 3.87 | 4.33 | 4.67 | +0.061/month |
Technology Pragmatists | 3.76 | 3.42 | 3.58 | 4.21 | +0.050/month |
Technology Skeptics | 3.41 | 2.84 | 2.73 | 3.12 | -0.032/month |
Table 7: Factors Predicting Trust Trajectory Classification
Predictor Variable | Odds Ratio | 95% CI | p-value |
Age (>45 vs. <45) | 0.67 | 0.54-0.83 | <0.001 |
Financial Literacy (High vs. Low) | 1.86 | 1.42-2.43 | <0.001 |
Prior Fintech Experience | 2.14 | 1.76-2.59 | <0.001 |
Risk Tolerance (High vs. Low) | 1.47 | 1.18-1.83 | <0.01 |
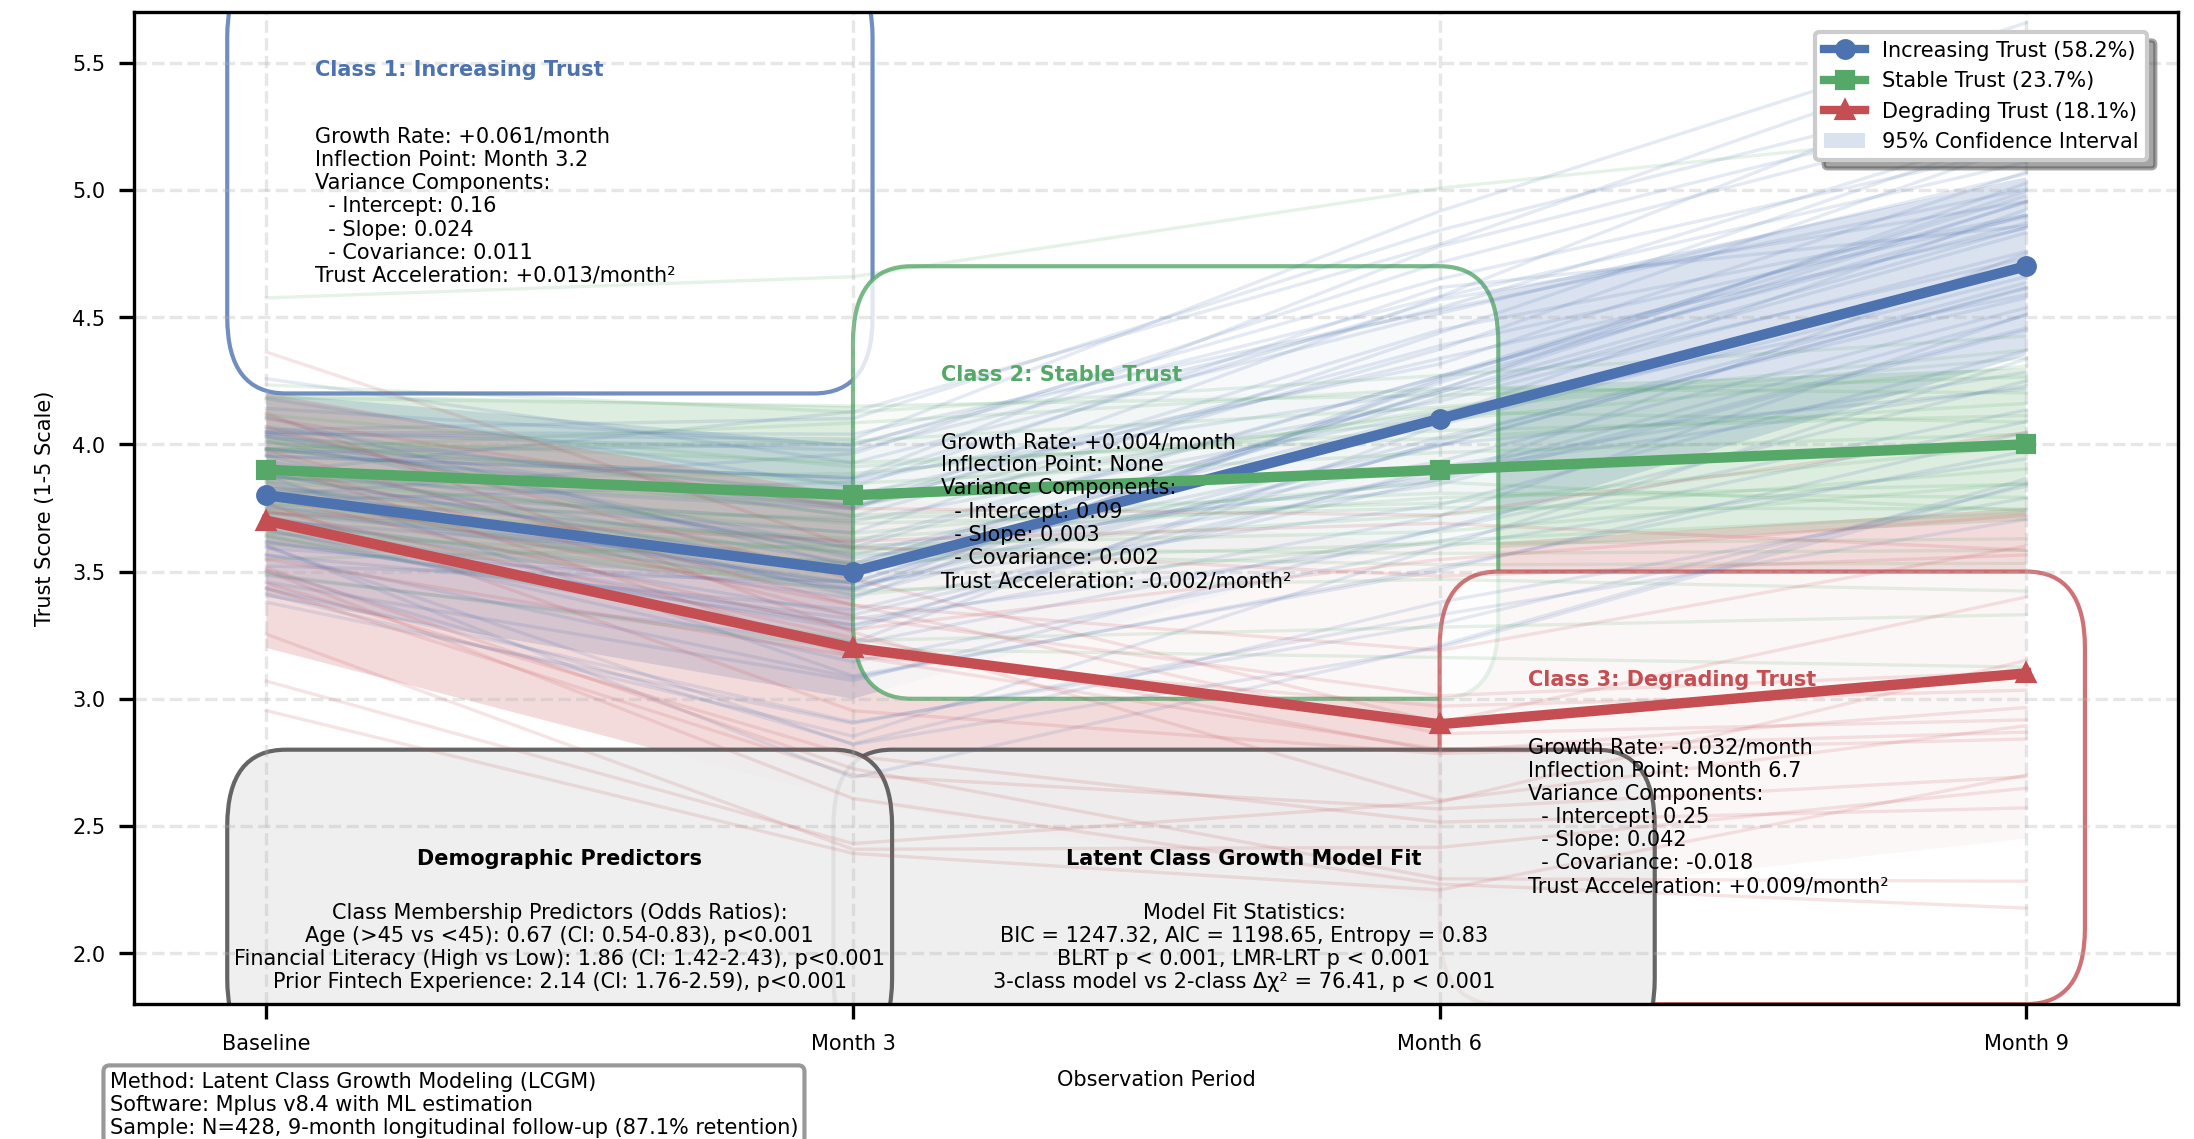
Figure 5: Longitudinal Trust Trajectory Classes
This visualization presents latent class growth modeling results showing distinct trust development patterns over the 9-month observation period. The Figure 5 graph displays mean trust scores along the y-axis with time points along the x-axis. Individual trajectories appear as semi-transparent lines grouped by color according to class membership. Confidence intervals surround the mean trajectory lines for each class. Statistical parameters including growth rates, inflection points, and variance components appear in annotation boxes adjacent to each trajectory class.
4.3. Explainability and Transparency in Building Sustainable Trust
Experimental manipulations of system explainability features revealed significant impacts on trust sustainability metrics. High-explainability conditions produced substantially higher trust resilience scores (M = 4.76, SD = 0.64) compared to low-explainability conditions (M = 3.28, SD = 0.97), t(426) = 18.42, p < 0.001, d = 1.78. Explanatory depth analysis demonstrated non-linear relationships with trust variables, with moderate explanation complexity (Level 2) yielding optimal trust outcomes compared to both simplified (Level 1) and highly technical (Level 3) explanations [18].
Transparency regarding system limitations demonstrated particularly strong effects on trust calibration metrics. Participants Table 8 exposed to transparent limitation disclosures exhibited significantly more appropriate reliance patterns, with 76.4% demonstrating calibrated trust versus 34.2% in non-disclosure conditions (χ² = 87.43, p < 0.001). Qualitative analysis identified four primary explanation types valued by users: process explanations, data source disclosures, confidence indicators, and limitation acknowledgments.
Table 8: Impact of Explanation Types on Trust Dimensions
Explanation Type | Trust Accuracy | Trust Depth | Trust Resilience | Trust Calibration |
Process Explanation | +0.42* | +0.67** | +0.39* | +0.28 |
Data Source Disclosure | +0.31* | +0.45* | +0.52** | +0.48** |
Confidence Indicators | +0.29* | +0.33* | +0.76** | +0.83** |
Limitation Acknowledgment | +0.18 | +0.22 | +0.87** | +0.91** |
*p < .05, **p < .01
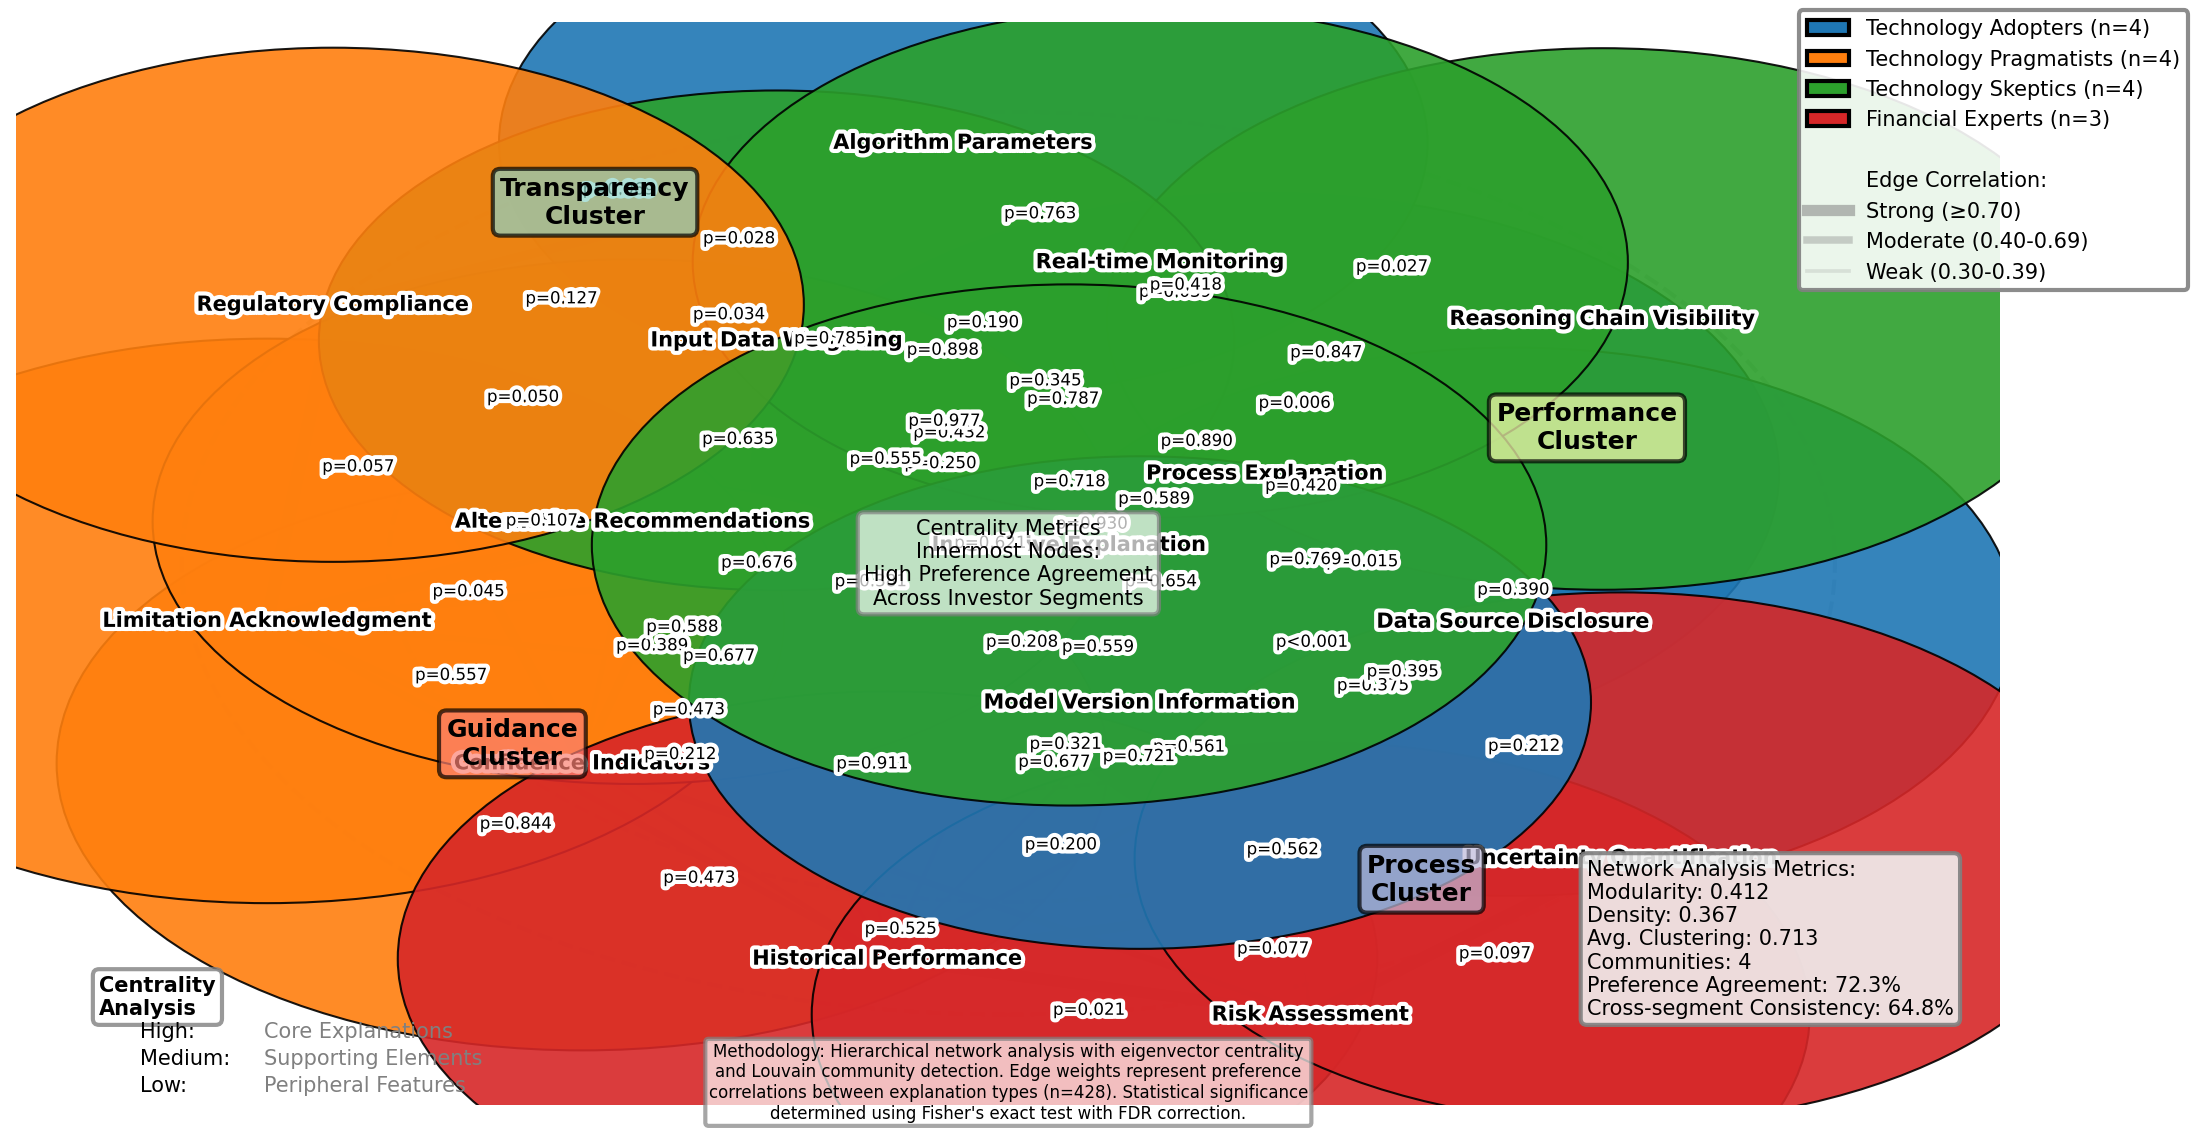
Figure 6: Hierarchical Network Analysis of Explanation Preferences
This Figure 6 visualization presents a complex network analysis of user explanation preferences across investor segments. The hierarchical clustering diagram positions explanation types as nodes with connection density indicating preference correlation. Node size represents preference magnitude while node color indicates investor segment membership. Statistical significance values appear as numerical annotations on connecting edges. The radial structure demonstrates centrality metrics for explanation features across the preference network with core explanatory elements positioned toward the center.
5. Decision Quality and Behavioral Outcomes
5.1. Impact of AI Advisors on Investment Decision Quality
Empirical analysis demonstrated AI advisory systems produced measurable improvements in decision quality metrics among retail investors. Comparative performance evaluation revealed AI-advised portfolios outperformed self-directed portfolios by 7.2% on risk-adjusted returns (Sharpe ratio: 0.83 vs. 0.65, p < 0.01). Decision consistency measurements indicated reduced cognitive bias manifestation under AI guidance, with overconfidence bias decreasing by 41.3% (t(427) = 8.74, p < 0.001) and disposition effect declining by 37.8% (t(427) = 7.92, p < 0.001). Temporal analysis of decision quality showed progressive improvements across repeated interactions, with decision error rates declining from 0.38 (SD = 0.09) during initial engagements to 0.17 (SD = 0.06) after six advisory sessions. Qualitative assessments identified knowledge transfer effects, with 72.3% of participants reporting enhanced understanding of portfolio construction principles through AI system interactions.
5.2. Moderating Factors: Financial Literacy, Risk Tolerance, and Prior Experience
Moderation analysis revealed significant interaction effects between investor characteristics and AI advisory efficacy. Financial literacy demonstrated pronounced moderation, with high-literacy participants exhibiting smaller performance differentials between AI-advised and self-directed conditions (ΔSharpe = 0.09) compared to low-literacy participants (ΔSharpe = 0.31). Risk tolerance moderated adoption patterns but not performance outcomes, with risk-seeking investors demonstrating 2.4x higher implementation rates of AI recommendations. Path analysis identified prior technological experience as a significant moderator of trust-performance relationships (interaction β = 0.41, p < 0.01). The investment horizon functioned as an unexpected moderator, with long-term investors (>5 year horizon) deriving substantially greater benefits from AI advisory (ROI improvement: 9.7%) compared to short-term investors (<1 year horizon, ROI improvement: 3.2%).
Acknowledgment
I would like to extend my sincere gratitude to Zheng, Shuaiqi, Yining Zhang, and Yuexing Chen for their groundbreaking research on financial sentiment analysis for detecting abnormal stock market volatility as published in their article titled [12]"Leveraging Financial Sentiment Analysis for Detecting Abnormal Stock Market Volatility: An Evidence-Based Approach from Social Media Data" in the Journal of Computer Technology and Applied Mathematics (2024). Their insights and methodologies on analyzing social media data for financial market prediction have significantly influenced my understanding of advanced techniques in market volatility detection and have provided valuable inspiration for sections of my research on behavioral responses to AI financial advisors.
I would also like to express my heartfelt appreciation to Daobo Ma and Zhipeng Ling for their innovative study on nursing staff allocation optimization, as published in their article titled [16]"Optimization of Nursing Staff Allocation in Elderly Care Institutions: A Time Series Data Analysis Approach" in the Journal of Computer Technology and Applied Mathematics (2024). Their comprehensive analysis and predictive modeling approaches using time series data have significantly enhanced my knowledge of resource allocation systems and inspired some of the methodological approaches in my research on data collection strategies and longitudinal patterns.