


1. Introduction
Food waste is a global concern, impacting economic stability, environmental sustainability, and food security. According to the FAO, over a billion tonnes of food, approximately one-third of annual production, is wasted each year. This waste contributes to greenhouse gas emissions, depletes resources like land and water, and exacerbates global hunger by diverting food from those in need. Addressing food waste is critical for sustainable development and resource conservation.
Governments, organizations, and researchers are turning to data-driven approaches to understand food waste factors across households, retail, and food service sectors. Recent studies highlight the complexity of predicting food waste, requiring advanced analytical tools. Machine learning, particularly the Random Forest (RF) model, offers robust solutions by identifying key drivers through non-linear relationships and feature interactions.
This study explores the RF model's potential to predict and classify food waste across sectors, analyzing features such as household estimates, retail practices, food service data, and regional indicators. The RF model’s strength lies in its accuracy and ability to handle complex datasets, making it ideal for uncovering sector-specific waste patterns. By identifying significant predictors, this research provides actionable insights into the most impactful areas for intervention.
The findings aim to support policymakers, businesses, and consumers in reducing waste and fostering responsible food practices. Moreover, this study underscores the value of integrating machine learning into sustainability research, offering accurate analysis and data-driven recommendations for addressing food waste and promoting sustainable food management practices.
2. Literature review
In recent years, the application of machine learning (ML) in addressing food waste has gained significant attention as researchers and practitioners seek data-driven methods to combat this global issue. A growing body of literature highlights the potential of ML techniques in minimizing food waste across various sectors, from household settings to the catering and hospitality industries.
Panda and Dwivedi demonstrated the effectiveness of machine learning (ML) in reducing food waste by developing predictive models to identify high-waste zones, laying a foundation for smart computing advancements [1]. Dey et al. extended this by integrating ML with blockchain, cloud computing, and QR codes in a decentralized Web 3.0 system, "SmartNoshWaste," to enhance transparency and waste management in smart cities [2].
In the catering industry, Rodrigues et al. utilized ML for short-term demand forecasting, reducing over-preparation and waste in food services [3]. Malefors et al. applied ML to predict guest attendance in Swedish catering during COVID-19, reducing waste and achieving cost savings [4]. These studies highlight ML's potential for sustainable waste management across diverse sectors.
Tang et al. applied high-resolution ML models to predict food waste in Dongguan’s catering industry, demonstrating ML’s adaptability to regional contexts [5]. Similarly, Singh and Kaunert employed ML and deep learning in hospitality operations to promote sustainable food consumption and achieve zero-waste goals [6].
In kitchen and household settings, Zhang et al. used random forest modeling to manage kitchen waste, focusing on transforming waste into byproducts like hydrochar, showcasing innovative ML applications [7]. Grainger et al. explored household food waste, using ML to identify waste drivers and reduce false positives, providing reliable insights for waste reduction [8]. These studies highlight ML’s potential across sectors to foster sustainability and resource transformation.
Overall, these studies demonstrate that ML models, from basic predictive algorithms to advanced integration with technologies like blockchain and deep learning, offer effective solutions to address food waste across diverse settings. By accurately forecasting demand, identifying waste patterns, and facilitating resource conversion, ML has proven to be a versatile tool in the effort to reduce food waste. This body of research provides a comprehensive framework for applying ML in various food-related sectors, underscoring its potential to achieve meaningful reductions in food waste and support sustainable development goals.
3. Data and brief analysis
3.1. Data introduction
The data includes key variables on food waste, such as household, retail, and food service estimates (per capita and total), alongside confidence in estimates to gauge reliability. Geographic variables like M49 codes and regions enable regional waste pattern analysis, while combined figures aggregate annual waste per country. These variables support granular machine learning analysis across national, regional, and sectoral dimensions, aiding in classifying and predicting food waste patterns for informed reduction strategies.
3.2. Correlation analysis
Correlation analysis highlights key relationships among variables: Household estimates strongly correlate with the target variable (0.731), underscoring their importance in predicting food waste. Moderate correlation between retail and food service estimates (0.580) indicates interdependence, influencing classification outcomes. High correlations among duplicates, such as Household estimate and Household estimate .1 (0.964), suggest redundancy due to scaling or aggregation, which could be mitigated by dimensionality reduction or removing redundant variables. Additionally, the Confidence in estimate variable shows a weaker correlation with the target (0.310), modestly supporting prediction reliability. Addressing redundancy could improve model efficiency and interpretability.
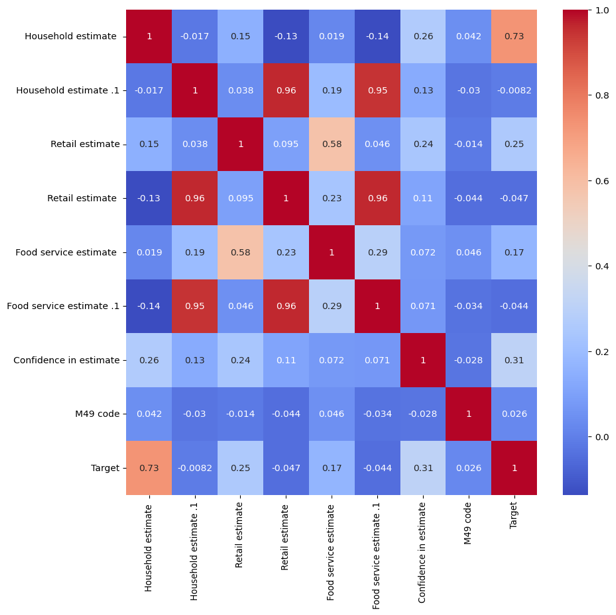
Figure 1: Correlation coefficient diagram
This image is a treemap showing various countries, with each country's box size representing a quantitative measure, the amount of food waste. Here’s a breakdown of the insights:
China and India occupy the largest boxes, indicating that they likely have the highest values in this measure, possibly due to their large populations. This suggests that food waste or the associated variable is significantly more substantial in these countries compared to others.
Following these, countries like Nigeria, Pakistan, Indonesia, and the United States of America also have large representations, showing that they rank high in the measured variable, though still much lower than China and India. This might reflect demographic or consumption patterns that contribute to the higher measurement.
Several mid-sized countries, such as Brazil, Ethiopia, Turkey, and Mexico, are grouped together, reflecting moderate levels of the variable in comparison to the leading countries. These countries are scattered across various continents, hinting that the variable is distributed globally but varies widely by region and country.
Smaller countries, such as Thailand, Kenya, and Iraq, occupy smaller sections, which indicate lower levels in the measured attribute. The high diversity of countries here suggests that many nations have relatively low values, possibly due to smaller populations or different consumption behaviors.
Finally, numerous countries occupy the smallest segments in the treemap, suggesting that their contribution to the measured variable is minimal. This could include smaller or less developed countries with lower overall consumption or production rates related to food waste.
The treemap provides a clear visual of the disparities between countries and regions, highlighting where interventions or policies may be prioritized if this is a food waste-related metric.
4. Random Foreset Model
4.1. Model introduction
Random Forest is an ensemble learning method that constructs multiple decision trees during training and outputs the mode of the classes for classification tasks or the mean prediction for regression tasks. Each decision tree is built from a subset of the data, created through bootstrapping (random sampling with replacement), and considers only a random subset of features at each split [9]. This approach reduces the variance compared to individual decision trees, making the Random Forest model more robust and less prone to overfitting [10].
Random Forest excels in food waste classification by handling high-dimensional data, managing missing values, and maintaining accuracy. Its interpretability allows ranking feature importance, identifying key drivers like waste estimates and regional codes. Its strength in handling non-linear relationships makes it ideal for complex food waste categorization.
4.2. Model results
The classification results of the Random Forest model indicate strong performance. With an accuracy of 95%, the model correctly classifies the majority of instances, showing its reliability in generalizing to the dataset.
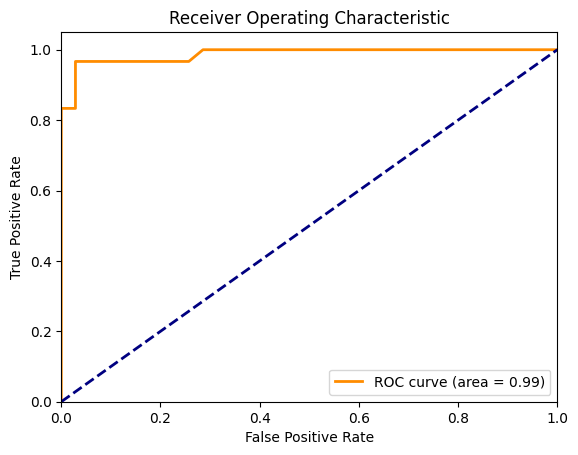
Figure 3: ROC curve
The precision of 0.97 suggests the model is highly effective at correctly identifying positive cases, with minimal false positives. Meanwhile, the recall of 0.93 indicates that the model captures 93% of actual positives, missing only a small number. This balance between precision and recall is further highlighted by the F1 score of 0.95, showing that the model performs well in both minimizing false positives and capturing true positives.
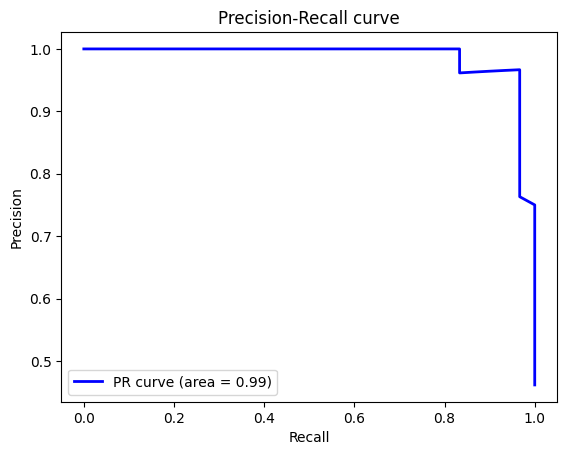
Figure 4: PR curve
The confusion matrix supports these metrics, with only a few misclassifications (1 false positive and 2 false negatives), demonstrating that the Random Forest model is robust and highly suitable for the classification task at hand.
4.3. Feature analyze
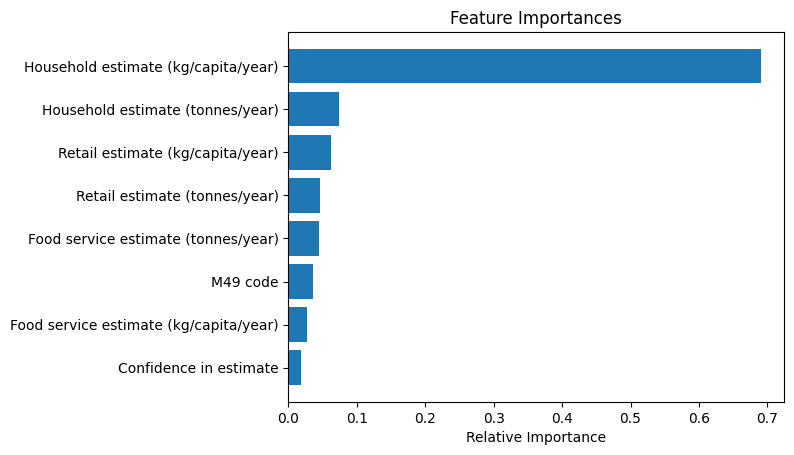
Figure 5: Feature Importances
The feature importance plot for the Random Forest model highlights "Household estimate (kg/capita/year)" as the most significant variable, indicating that household-level food waste per capita is the primary driver of predictions. This underscores the substantial impact of household behavior on food waste patterns.
The total "Household estimate (tonnes/year)" also shows notable importance, reinforcing the relevance of household contributions at individual and aggregate levels. In contrast, "Retail estimate" and "Food service estimate" metrics, along with variables like "M49 code" (regional data) and "Confidence in estimate," have significantly lower importance, suggesting their limited influence in the model.
This analysis emphasizes household data, especially per capita, as critical for predicting food waste. Policymakers and organizations should focus on household-targeted interventions, such as education on waste reduction, to effectively address food waste issues.
5. Conclusion and Suggestion
5.1. Conclusion
In conclusion, this study demonstrates the effectiveness of using machine learning, specifically the Random Forest model, for classifying and predicting food waste across various sectors. The analysis reveals that household-level food waste estimates, particularly on a per capita basis, are the most influential factors driving food waste predictions. This insight underscores the substantial role that household behaviors play in overall food waste generation, compared to other sectors like retail and food services. By identifying the most impactful variables, this research contributes valuable data-driven knowledge that can inform targeted interventions to address food waste on both local and global scales.
5.2. Suggestion
This study provides targeted suggestions to address food waste based on insights from Random Forest model analysis, offering strategies for households, retailers, food service providers, and policymakers.
Household-Level Interventions: As households contribute significantly to food waste, public awareness campaigns should focus on education about purchasing, storage, and portion control. Incentives, such as rewards for sustainable practices or smart storage tools, can further encourage waste reduction.
Data Collection and Monitoring: Standardizing food waste data collection through surveys, waste audits, and digital tracking tools can improve prediction models and interventions, enabling more precise targeting of high-waste regions or demographics.
Retail Sector Strategies: Retailers should adopt waste-reduction measures, such as dynamic pricing for perishable items, "ugly produce" campaigns, and partnerships with food banks. Government incentives like tax breaks can encourage these practices.
Sustainable Practices in Food Service: Restaurants and catering services can reduce waste by offering customizable portions, training staff, and using food tracking software. Certifications or rewards for sustainability efforts can motivate businesses and attract environmentally conscious consumers.
Regional and Cultural Customization: Tailoring interventions to local contexts, such as mindful consumption education or improved food storage infrastructure, ensures relevance and effectiveness. Collaboration with community leaders can enhance cultural resonance.
Innovation and Technology: AI-based inventory management, smart refrigerators, and apps that optimize food usage can help minimize waste. Governments and private sectors should invest in R&D for such technologies and predictive analytics for waste management.
Policy Evaluation: Continuous evaluation and adjustment of waste policies, with metrics and stakeholder feedback, ensure their long-term impact and relevance. A multi-faceted approach integrating education, incentives, and technology is crucial for reducing food waste across sectors.