


1. Introduction
The volatility of the global energy market has always been a crucial factor influencing international economic activities. In the context of accelerating global energy transformation and low-carbon development, the impact of electricity price fluctuations on the global economic system has become increasingly prominent. As a vital component of the international economy, changes in electricity prices not only affect the economic structures of energy-producing and consuming countries but also exert significant influence on the functioning of major economies worldwide through commodity markets, financial markets, and global supply chains.
Electricity price fluctuations are closely tied to various factors, including the global economic cycle, financial market fluctuations, exchange rate variations, monetary policies, international trade relations, and geopolitical events. Since 2000, electricity prices have experienced several notable fluctuations, influenced by factors such as economic crises and shifts in energy demand.
Simultaneously, the global energy landscape is undergoing profound changes due to the pursuit of low-carbon development goals. The rapid growth of renewable energy sources and improvements in energy efficiency are gradually reducing reliance on fossil fuels, thereby impacting traditional energy markets. Many economies worldwide have set ambitious carbon neutrality targets under the Paris Agreement framework, driving investment growth in clean energy while introducing significant uncertainty in the fossil fuel market, further exacerbating electricity price volatility.
The advent of Generative AI is set to revolutionize the way we predict electricity prices. These AI algorithms have the ability to generate data that is similar to the data they are trained on, enabling them to predict future trends based on past patterns. They can simulate various scenarios and outcomes, offering a more comprehensive understanding of potential electricity price fluctuations. Generative AI has the potential to manage the complexity and unpredictability of the global energy market. Unlike traditional models, generative AI can learn and adapt to new information, making it more efficient and accurate in predicting future electricity prices. As a result, these models can aid in better understanding the risk and uncertainty associated with electricity price volatility.
In this context, accurately predicting electricity prices has become an urgent challenge for policymakers and participants in financial markets. Traditional forecasting methods have typically relied on the analysis of macroeconomic indicators and supply-demand fundamentals. However, as data scales expand and market environments become increasingly complex, the limitations of traditional methods are becoming more apparent.
2. Literature Review
In the electricity market, accurate forecasting of electricity price is of great significance to the operation of power system and the decision-making of market participants. In recent years, many scholars have adopted different methods to forecast short-term electricity price. This paper summarizes some short-term electricity price forecasting methods based on time series and machine learning model.
In terms of time series model, Traditional time series models, such as ARIMA and its variants, are widely used in electricity price forecasting because of their simplicity and effectiveness. Pan Yurong and Jia Chaoyong made short-term electricity price forecast based on seasonal ARIMA model, showing good forecasting accuracy [1]. Zhang Yihong et al. also adopted the autoregressive integral moving average model to forecast the day-ahead electricity price [2]. In addition, ARIMA-GARCH combined with wave model and ARIMAX model combined with wavelet transform also show the potential to improve the prediction accuracy [3-4].
In terms of machine learning model, In recent years, the application of deep learning technology in electricity price forecasting has gradually increased. Guo Xueli et al. proposed a method based on improved VMD, PSO and CNN-LSTM, which showed high prediction accuracy and generalization ability [5]. Zhu Xiaojing and Xue Ruimeng used wavelet transform and Bi-LSTM-TCN model to forecast short-term electricity price, which further improved the forecasting effect of the model [6].
In terms of mixed model, The mixed model combining multiple methods shows advantages in improving the prediction accuracy and stability. In addition, the model using a combination of various algorithms, such as the combined model of LSTM and XGBoost and the LSTM method of variational modal decomposition and Adam optimization, also proved its effectiveness in electricity price forecasting [7-8].
3. Data and Model Analysis
3.1. Data Introduction
This comprehensive dataset offers a detailed look at the United States electricity market, providing valuable insights into prices, sales, and revenue across various states, sectors, and years. With data spanning from 2001 onwards to 2024, this dataset is a powerful tool for analyzing the complex dynamics of the US electricity market and understanding how it has evolved over time.
This file contains monthly data on electricity prices, sales, and revenue in the United States, disaggregated by state and sector (residential, commercial, industrial, and other) from 2001 onwards. The dataset includes variables such as the average price per kilowatt-hour (kWh), total revenue, total sales, and the number of customers (where available).
3.2. Model Introduction of ARIMA
In the realm of time series forecasting, this paper employs the ARIMA (AutoRegressive Integrated Moving Average) model to predict electricity prices in the United States. The ARIMA model is a popular statistical approach for analyzing and forecasting time series data, particularly when the data exhibit patterns over time. It combines three key components: autoregression (AR), differencing (I), and moving averages (MA), allowing it to capture both the temporal dependencies and trends present in the data.
The autoregressive component utilizes past values of the series to predict future values, while the integrated part involves differencing the series to achieve stationarity—an essential requirement for effective modeling. The model selection process involves determining the optimal parameters for the AR and MA components, often achieved through techniques like the Akaike Information Criterion (AIC) or Bayesian Information Criterion (BIC). After fitting the ARIMA model to the electricity price data, the model forecasts future prices by leveraging the identified patterns.
3.3. Model Introduction of LSTM
In the aspect of model selection, this paper uses the LSTM (long-term and short-term memory network) model to predict the time series of electricity prices in the United States. The LSTM model is a special recurrent neural network (RNN) that can effectively capture long-term dependencies in time series by introducing a Memory Cell. Traditional RNNs are prone to issues like gradient vanishing or gradient explosion when processing long series data, making it difficult for the model to retain earlier information. LSTM addresses these challenges through the mechanisms of the "forget gate," "input gate," and "output gate" within its internal structure, enabling it to perform well when handling long-term dependent data.
Based on the trained LSTM model, this paper forecasts electricity prices in the U.S. over the next few days. By comparing the predicted values with actual data, this paper evaluates the model's prediction accuracy in detail and discusses the advantages and limitations of the LSTM model in dealing with the complex fluctuations of electricity prices. Moreover, the forecasting results presented in this paper not only provide valuable insights into the future trends of U.S. electricity prices but also offer data support for market participants when making energy-related investment decisions.
4. ARIMA model analysis
This paper extracts the data from 2001 to 2024, resamples the electricity price data on a monthly basis, and generates a time series of monthly average electricity prices. Furthermore, Figure 1 illustrates this time series to show the long-term trend and fluctuations of electricity prices in the United States during this time period.
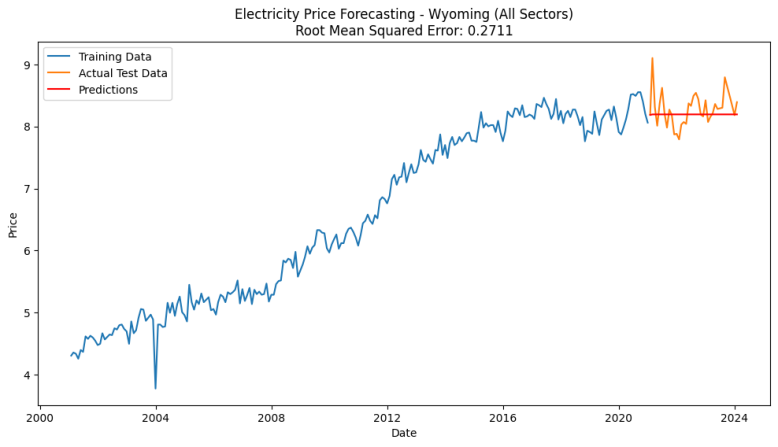
Figure 1: Price time series figure
The SARIMAX model results indicate that the ARIMA(1, 1, 1) model was applied to predict electricity prices, utilizing a dataset of 240 observations from January 2001 to December 2020. The model produced an Akaike Information Criterion (AIC) of -173.001, suggesting a relatively good fit.
Among the coefficients, the moving average component (MA(1)) was statistically significant with a coefficient of -0.5147 and a p-value of 0.000, indicating its strong influence on the model. In contrast, the autoregressive component (AR(1)) was not statistically significant, with a p-value of 0.661. The variance estimate (σ²) was significant, reinforcing the model's ability to capture fluctuations in electricity prices.
Diagnostic tests showed no autocorrelation in the residuals, as indicated by the Ljung-Box Q statistic. However, the model exhibited non-normality and heteroskedasticity, as evidenced by the Jarque-Bera and heteroskedasticity tests. These findings suggest that while the model captures key dynamics in electricity prices, further refinements may be necessary to address the issues of non-normality and heteroskedasticity.
5. LSTM model analysis
In this experiment, the LSTM model is used to predict the residential electricity price in the United States. The results show that the model shows a significant underestimation tendency in the high price range, especially when the actual price exceeds 15, the predicted value is mostly below 20. For the lower price range (between 5 and 15), the prediction of the model is concentrated, but there are still some deviations from the ideal 45-degree reference line. This shows that the model has errors in the overall forecast, especially in the case of higher prices, and fails to accurately capture the changing trend of actual prices.
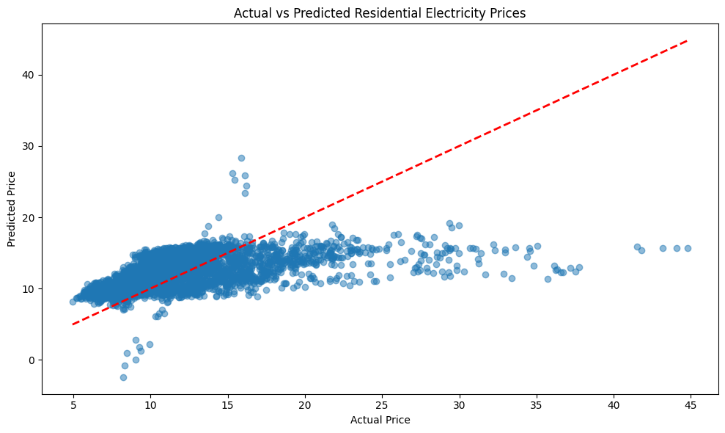
Figure 2: LSTM Model Predicted results
This phenomenon may be due to the under-fitting of the model, especially in the high price range, LSTM failed to identify the complex patterns in the data. In addition, the uneven distribution of training data may be another reason, especially in the higher price range, the number of data samples may be insufficient, which leads to the poor generalization ability of the model. In addition, the lack of feature selection or data preprocessing may further limit the model's ability to capture key patterns.
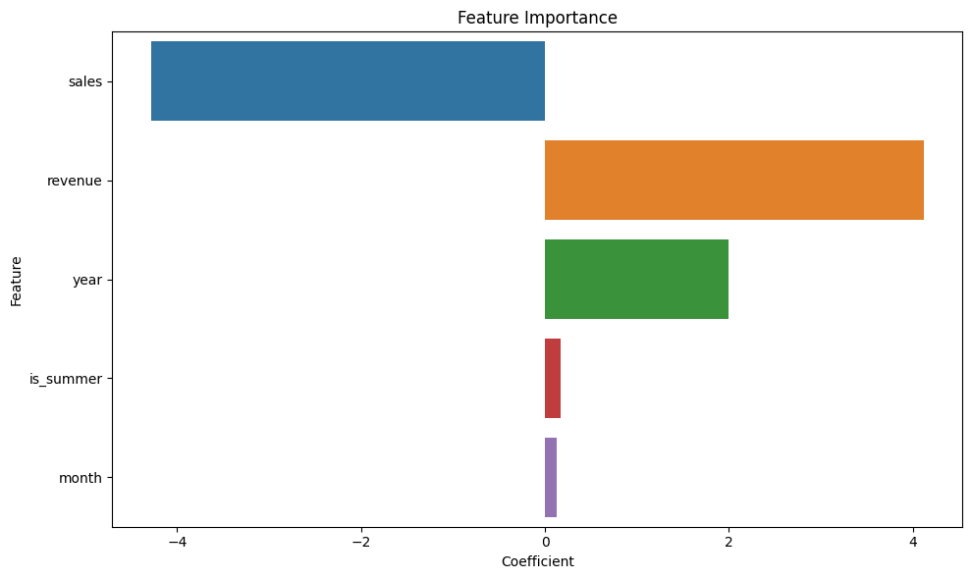
Figure 3: Feature Importance of LSTM
Figure 3 shows the importance of each feature in the model for forecasting electricity price, that is, the regression coefficient of each feature. The Sales feature has a significant negative coefficient, indicating that the sales volume has a strong negative impact on the electricity price. With the increase of sales volume, the predicted electricity price decreases, which may reflect economies of scale or other market factors related to sales volume.
Revenue feature shows a positive coefficient, indicating that the higher the income, the higher the electricity price. This may indicate that the increase of income is related to the change of market demand, which in turn affects the price. The Year feature also has a positive impact, which means that with the increase of the year, the electricity price shows an upward trend. This may be due to inflation, policy changes or rising energy costs year by year. The characteristics of Is_summer and Month have little influence on the price, and the coefficient is close to zero, indicating that seasonal changes and months have no significant effect on the forecasted electricity price.
It can be seen from the characteristic importance diagram that sales volume and income play a key role in the forecast of electricity price. The increase in sales leads to the decline in prices, while the increase in income pushes the price up. The characteristics of year show that the price of electricity increases gradually with time, while seasonal factors and months have little influence on the price.
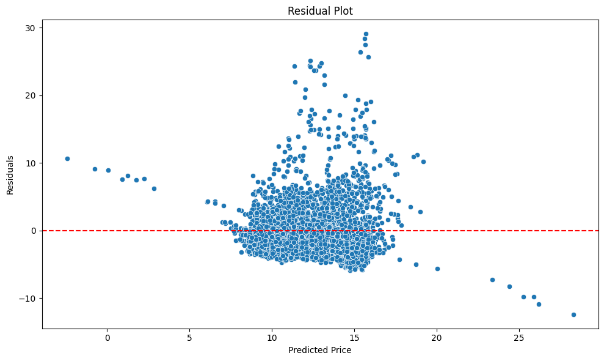
Figure 4: LSTM Model Residual Plot
Figure 4 shows the residual distribution of the power price predicted by the model. Most of the residuals are concentrated in the range of 10 to 15, and are symmetrically distributed around the 0-line, which shows that the prediction of the model in this price range is more accurate and the error is smaller. In the range of higher forecast price, the fluctuation of residual is obviously increased. Especially when the predicted price exceeds 20, the error of the model becomes more significant, which shows that the positive residual increases, which means that the model underestimates the high price. In the area where the predicted price is close to 0, the residual error shows obvious negative deviation, which means that the model predicts the lower price on the high side.
6. Conclusions
The research conducted in this paper highlights the significant complexities and volatility associated with electricity price forecasting, accentuated by the ongoing shifts towards low-carbon development and the increasing penetration of renewable energy sources. The analysis of various forecasting models, including the traditional ARIMA model and the more contemporary LSTM model, underscores the evolving landscape of energy market analysis.
The ARIMA model, with its emphasis on autoregression, moving averages, and differencing, has demonstrated a commendable ability to capture and predict trends in electricity prices based on historical data. However, its limitations are evident in scenarios where market conditions are highly volatile or when the data exhibit non-linear characteristics. The necessity for stationarity and its sensitivity to outliers can restrict the ARIMA model's applicability under dynamic market conditions, as seen in the statistical challenges of non-normality and heteroskedasticity revealed in the model diagnostics.
On the other hand, the LSTM model, designed to overcome the shortcomings of traditional RNNs by effectively managing long-term dependencies, shows promise in handling the complex patterns observed in electricity prices. Nonetheless, this model's tendency to underestimate high price ranges indicates potential issues with underfitting and the challenge of managing disparate data distributions. The need for extensive data preprocessing and feature selection to enhance the model's performance is evident, as is the necessity for a robust training dataset that adequately represents all price levels.