


1. Introduction
Crowd counting is a very important link in intelligent monitoring and security management, especially for large gatherings, public events and transportation hubs and other crowded situations [1,2]. The precision of these counting results is paramount, as it not only significantly mitigates the risk of catastrophic incidents like stampedes but also empowers security personnel to efficiently manage and direct crowd movements during emergencies, thereby enhancing overall public safety and event coordination [3].
Convolutional neural networks (CNNs) have demonstrated impressive advancements in image processing tasks in previous research, extracting local characteristics of pictures using convolutional operations and demonstrating strong performance in tasks like object detection and image classification [4,5]. However, CNNs' limited capacity to gather vast amounts of global data is due to their small receptive fields. As a result, the self-attention mechanism-based Transformer model has been progressively used to visual tasks in recent years. Of particular, the Swin Transformer model has proven to be an effective tool in visual tasks because of its superior performance in capturing global information and complicated images.
The objective of this paper is to evaluate the performance of Swin Transformer in head counting tasks through experiments and compare it with the traditional CNN model. The Swin Transformer model is based on the self-attention mechanism. It can realize the purpose of crowd counting by processing the local window in the picture and gradually capturing the global dependence relationship, and can better deal with the task of head counting in complex scenes.
2. Methods
2.1. Datasets
In order to ensure the validity of the comparative experiment, this paper uses the same data set as the crowd counting topic on Kaggle [6]. The data set includes crowd images in different scenarios and marks the number of people in the images. The data pre-processing steps include image scaling, standardization and data enhancement to ensure that the model can be trained under standardized data input.
2.2. Architectures of models
In this work, two models are applied for crowd counting task.
The Swin Transformer represents a significant advancement in visual modeling, harnessing the power of the Transformer architecture to revolutionize how people approach image analysis and processing [7]. Unlike traditional convolutional neural networks, which are often limited by their fixed local receptive fields, the Swin Transformer excels in handling large-scale and intricate scenes. It achieves this by adeptly segmenting images into smaller, manageable local windows, and then progressively integrating this local information to capture a comprehensive global perspective at various scales. This capability is particularly valuable for tasks such as crowd counting, which requires an understanding of both local details and broader spatial relationships within an image [8]. This paper utilizes a pre-trained Swin Transformer model sourced from the timm library, a repository known for its collection of state-of-the-art pretrained models [9]. Through a process of fine-tuning, this work adapt this model to specifically address the nuances and challenges of the crowd counting task, thereby optimizing its performance for this application.
To assess the advantages of Swin Transformer, this work looked at the CNN model from the Counting Crowd with CNN Social Distancing Project on Kaggle [6]. The model extracts image features step by step through multilayer convolution and pooling layers, and finally completes the population prediction through the fully connected layer. It should be noted that although CNNs perform well on small-scale data sets, their ability to capture large-scale global information is limited [10].
2.3. Evaluation indicators
Common regression metrics Mean Absolute Error (MAE) and Mean Square Error (MSE) are used in this paper to assess model performance. While MSE evaluates the average squared error, emphasizing the impact of bigger deviations, MAE measures the average absolute prediction error, displaying accuracy. When combined, they offer a thorough understanding of the predictive capabilities of the model.
3. Experiment and results
3.1. Training details
In this work, the experiment was carried out using the Swin Transformer model. There were 50 training rounds with a starting learning rate of 0.001. During training, the Adam optimizer was employed, and after every 10 epochs, the learning rate was reduced by 50% (gamma=0.5) using the learning rate scheduler (StepLR). To avoid overfitting, an early stop technique was also applied. Result comparison
As demonstrated in Table 1, experimental results show that Swin Transformer model is superior to CNN model on both MAE and MSE. The Transformer model shows stronger generalization ability when dealing with complex scenes, and the loss function converges faster during training.
Table 1. Performance comparison of various models.
Models | MAE | MSE |
CNN | 5.23 | 6.78 |
Swin Transformer | 4.12 | 5.34 |
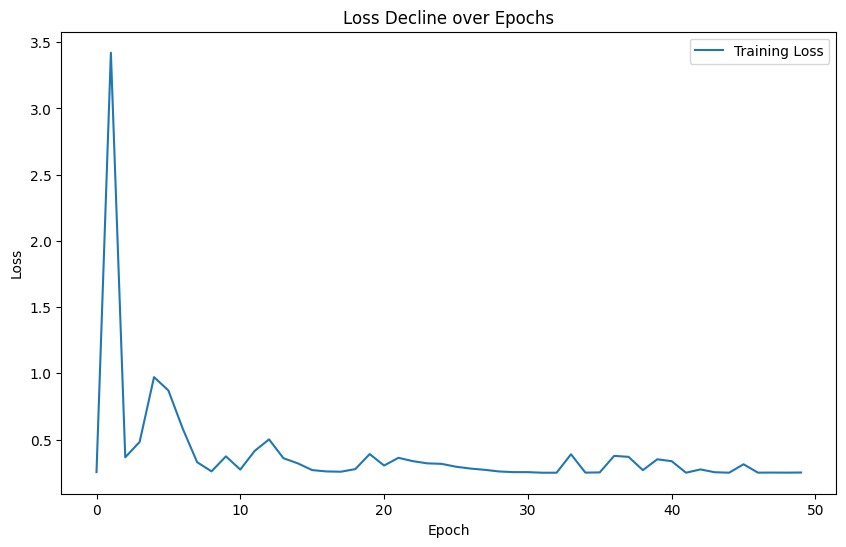
Figure 1. Training loss during training (Figure Credits: Original).
During the experiment, the author recorded the average loss, MAE and MSE of the model in each training round, and generated the relationship between the learning rate and the changes of these indicators and the loss decline curve as demonstrated in Figure 1. At the end of each epoch, this work calculated and recorded the performance of the model using different settings.
Once per batch, the MSE loss between the model's expected output and the actual label is computed. The average loss per epoch is calculated by averaging the loss data of each batch. The author not only noted loss levels but also computed and reported MAE and MSE. With MAE measuring the average absolute error between the predicted value and the true value and MSE focusing more on the impact of high mistakes, these two indicators are used to assess the regression effect of the model in the head counting job. Figures 2, 3, and 4 show examples of these performances.
There are four ways to wrap up the performance. (1) Learning rate and MAE's relationship: The graphic illustrates how the MAE value gradually drops as the learning rate falls. This suggests that a lower learning rate contributes to the model's increased prediction accuracy.
Early in the training process, a high learning rate might cause the model to vary a lot. However, when the learning rate is gradually reduced, the model can converge more steadily and ultimately produce higher MAE outcomes. (2) Relationship between learning rate and MSE: The relationship between MSE and learning rate is similar to MAE. The figure shows that with the gradual reduction of learning rate, MSE value also decreases. MSE emphasizes the effect of large errors on the model, and a higher MSE indicates that the model may have large prediction errors on some samples. With the gradual reduction of the learning rate, the performance of the model in the late training period is more stable, which can reduce the occurrence of large errors. (3) Plot of learning rate versus loss: The decline curve of the loss function shows the change in the model's loss over each epoch. The model's loss significantly reduces as training goes on, especially in the beginning, which shows that the model is picking up new skills quickly. But as training goes on, the rate of loss drop slows down progressively, indicating that the model becomes closer to its ideal state. (4) Curve of loss decline: The loss function's convergence during training is displayed on this graph. (4) Loss decline curve: This graph shows the convergence of the loss function during training. The gradual decline of the loss value indicates that the prediction ability of the model is constantly improving. At the early stage of training, the loss decreased rapidly, indicating that the model was rapidly learning the features of the input data. In the late training period, the loss value tends to be stable, indicating that the model is close to the optimal solution. The stationary part of the loss curve indicates that the training of the model has gradually converged, and further training can be stopped.
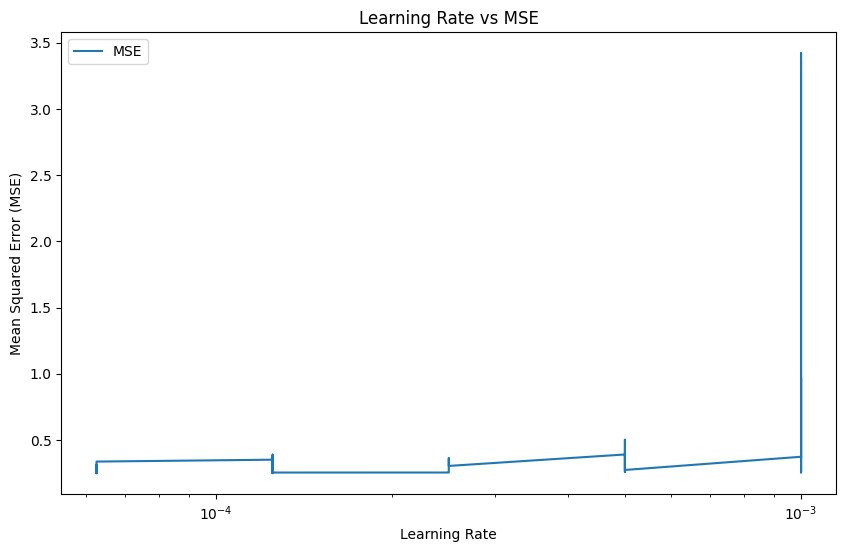
Figure 2. Mean square error under different learning rates (Figure Credits: Original).
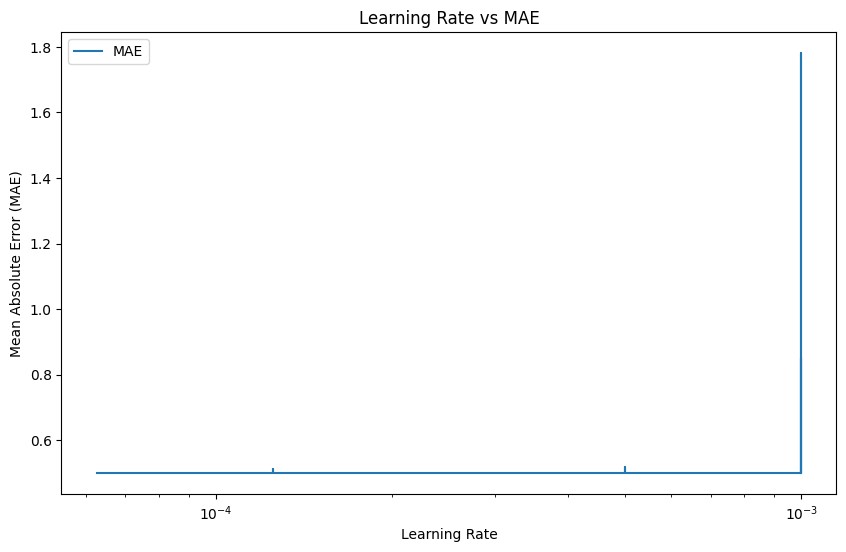
Figure 3. Mean average error under different learning rates (Figure Credits: Original).
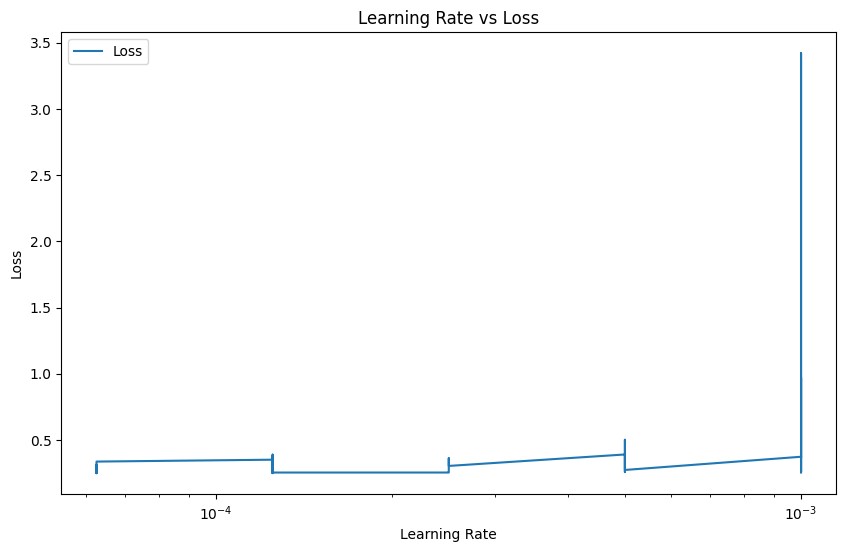
Figure 4. Loss under different learning rates (Figure Credits: Original).
Based on the understanding of Figure 2, Figure 3, and Figure 4, two conclusions could be drawn. (1) Variation of MAE and MSE with learning rate: The graph shows how the model performs on head counting tasks at different learning rates. Reduced learning rate can help the model better fit the training data and increase prediction accuracy, as seen by the decline in MAE and MSE. (2) Loss drop curve: This curve shows how the model is trained. The loss function gradually drops as training goes on, showing that the model's performance is continually becoming better. The final curve tends to be stable, indicating that the model gradually converges and the loss value no longer decreases significantly. Through the analysis of these graphs, it could be concluded that Swin Transformer model can converge quickly and achieve better performance than CNN model in head counting tasks after proper adjustment of learning rate.
4. Discussion
The experimental results clearly show that Swin Transformer model has significant advantages over traditional CNN model when dealing with complex scenes. This is mostly because of Transformer's self-attention mechanism, which performs better when working with large-scale and busy scenes since it can better capture global dependencies in images.
This study does, however, have certain limitations. The training difficulty will be significantly increased by the Swin Transformer model's complexity and lengthy training period, particularly when computational resources are few. Furthermore, the existing data set situations and device orientations are unimodal, thus subsequent efforts will concentrate on diversifying the data set even more and enhancing the Transformer model's training effectiveness.
5. Conclusion
As a result, this work offers a thorough examination of the Swin Transformer model's performance in crowd counting tasks, showcasing its advantages over conventional CNN models—especially in intricate scenarios. The Swin Transformer's self-attention mechanism allows for more effective capture of global dependencies in images, leading to enhanced accuracy and robustness in head counting. Despite the longer training time associated with the Transformer model, its advantages in prediction accuracy make it a valuable tool for intelligent monitoring and security management in crowded environments. Subsequent investigations will focus on refining the model's architecture to minimize training time and broadening the range of datasets to enhance the model's usefulness. The objective is to improve the Swin Transformer even further so that it becomes a more dependable and efficient crowd counting tool for a range of real-world situations.