

1. Introduction
Music recommendation system refers to the analysis of the user's historical listening records, ratings, reviews and other information to recommend music works that meet their personalised tastes [1]. In the research of music recommender system, there are several directions such as content-based recommendation, collaborative filtering-based recommendation, hybrid model-based recommendation, and label-based recommendation [2,3]. Among them, collaborative filtering-based recommendation is one of the most commonly used methods at present [4]. This method analyses the user's historical listening records and ratings to identify other users with similar interests to the user, and recommends music pieces that these users like [5]. However, the method suffers from the cold-start problem, i.e., it cannot make accurate recommendations for new users or new songs [6]. For this reason, researchers have proposed various solutions, such as tag-based recommendation and content-based recommendation [7].
Among these methods, K-Means clustering analysis is also widely used in music recommendation systems [8]. K-Means clustering is an unsupervised learning algorithm that divides a dataset into K clusters, each representing a cluster centre [9]. In a music recommendation system, each song can be considered as a data point, and its feature vector can be used as input data, and then the K-Means algorithm can be used to divide the songs into different clusters. In this way, when a user selects a song, the system can find other songs that are similar to that song and recommend them based on the user's historical listening records [10].
Music recommendation system is a complex problem and uses a variety of algorithms and techniques.K-Means cluster analysis, as one of the methods, has a wide range of applications in music recommendation systems to improve the accuracy and efficiency of recommendations. In this paper, a music recommendation system is developed for existing open source music datasets based on exploratory data analysis and K-Means cluster analysis method for accurately recommending works to users that match their tastes.
2. Data visualisation and exploratory data analysis
In this paper, we have selected the open source dataset of music recommender systems from the UCL database and performed visual and exploratory analyses of the metrics of the dataset. The significance of statistics on music popularity trends in previous years is to help us understand the development and changes in the music market, as well as consumer preferences and trends. By analysing music popularity trends over the past years, future music trends can be predicted, which is important for music producers, music companies and music promoters. In addition, understanding music trends can help promote the music industry and provide guidance and reference for music creation and marketing. In this paper, we first visualise and analyse past music trends, and the results are shown in Figure 1.
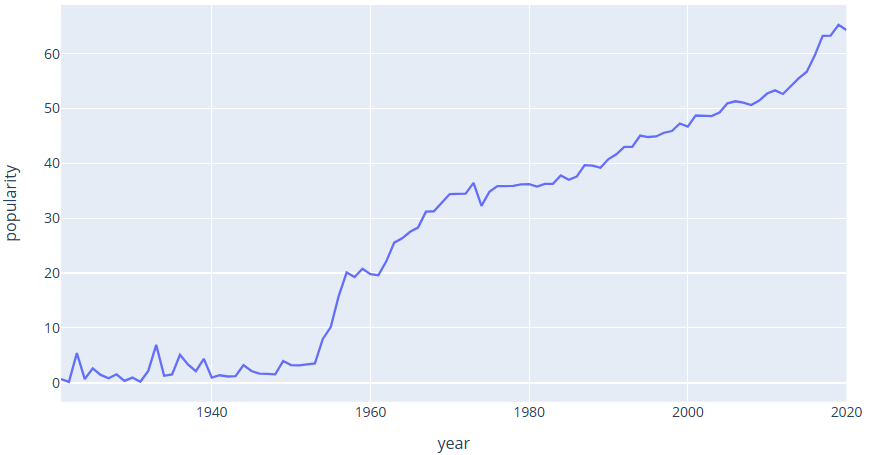
Figure 1. Visualisation and analysis of music trends.
(Photo credit: Original)
As can be seen from Figure 1, popular music showed explosive growth from 1950 to 1970, then the growth rate gradually levelled off, and then exploded again in recent times.
The number of songs in each decade is counted, and the bar chart is shown in Fig. 2; the popular genres are sorted by popularity, and the bar chart is plotted, as shown in Fig. 3; and the top ten popular artists are summarised and counted, and the bar chart is shown in Fig. 4.
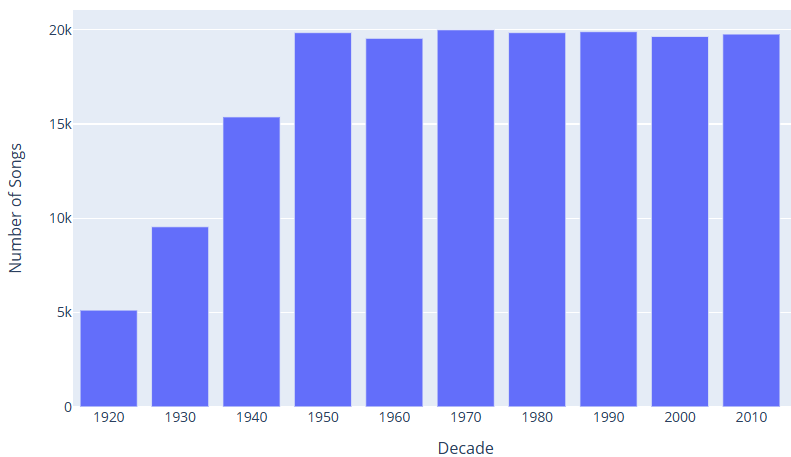
Figure 2. Statistical analysis of bar charts.
(Photo credit: Original)
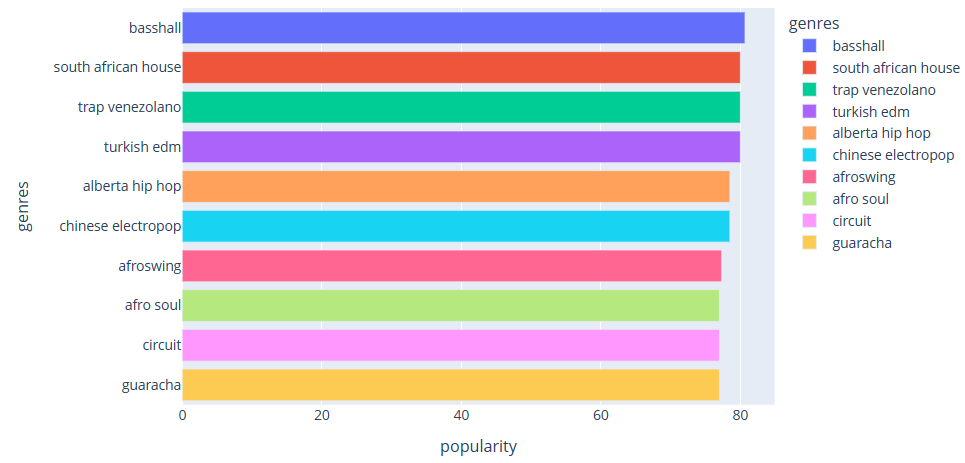
Figure 3. Statistical analysis of bar charts.
(Photo credit: Original)
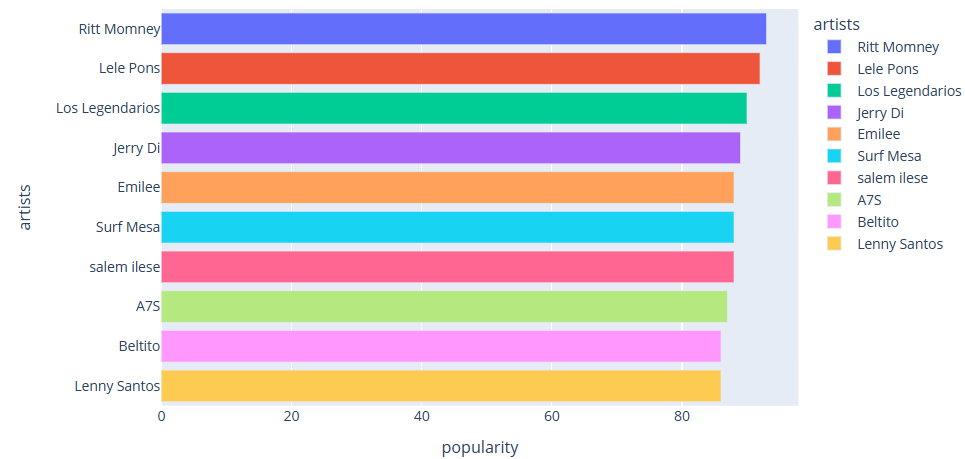
Figure 4. Statistical analysis of bar charts.
(Photo credit: Original)
3. Relevance analysis
Correlation analysis is a statistical analysis method used to study the relationship between two or more variables. It helps us to determine the correlation between variables, i.e. how they vary together. Correlation analysis can be used to study any type of variable, including quantitative, categorical, and ordinal variables.
In correlation analysis, we usually use the correlation coefficient to measure the relationship between variables. Correlation coefficients can take values from -1 to 1, where -1 means a perfect negative correlation, 0 means no correlation, and 1 means a perfect positive correlation. The closer the correlation coefficient is to -1 or 1, the stronger the relationship between the variables, while the closer it is to 0 the weaker the relationship.
To analyse the relationship between music popularity and music acoustic properties, the correlation coefficients between music popularity and sound effects, danceability, energy, instrumentality, liveliness, loudness, speech, rhythm, mood, duration (milliseconds), and key were calculated, and the results are shown in Figure 6.
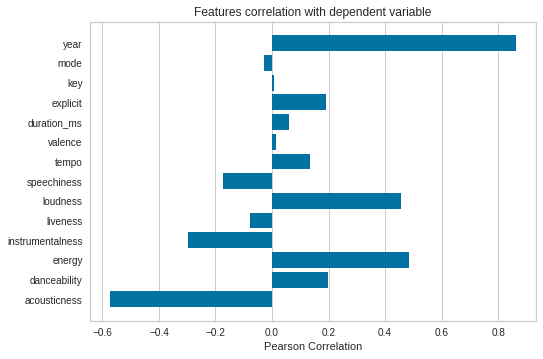
Figure 5. Relevance analysis.
(Photo credit: Original)
4. K-means algorithm for clustering genres
K-means cluster analysis is an unsupervised machine learning algorithm for dividing a data set into k distinct clusters. The algorithm determines the similarity between data points based on a distance metric and assigns similar data points to the same cluster. In this paper, we will explore the principles of K-Means cluster analysis, including the algorithmic process, distance metric and the method of updating cluster centres.
The algorithm flow of K-Means cluster analysis is as follows: first, k data points are randomly selected as cluster centres. Then, the distance from each data point to each cluster centre is calculated and assigned to the cluster with the closest distance. Next, the centroid of each cluster is recalculated and the process of assigning and updating the cluster centres is repeated until a specified number of iterations is reached or the cluster centres no longer change. Eventually, the algorithm returns k clusters and their corresponding centroids.
Distance metric is one of the core concepts of K-Means cluster analysis. The distance metric is used to calculate the similarity between data points, usually using the Euclidean distance or the Manhattan distance. Euclidean distance is the straight line distance between two data points while Manhattan distance is the Manhattan distance between two data points. The choice of distance metric has a significant impact on the results of cluster analysis, so it is necessary to choose the appropriate distance metric for the specific problem.
The method of updating cluster centres is another important concept in K-Means cluster analysis. In each iteration, the cluster centre needs to be updated based on the average of all data points within the cluster. Specifically, for each cluster, the average of all its data points is calculated and used as the new cluster centre. This ensures that the cluster centre is always at the centre of the data points within the cluster, thus maximising the similarity of the data points within the cluster.
K-Means cluster analysis is an unsupervised machine learning algorithm for dividing a dataset into k distinct clusters. The algorithm determines the similarity between data points based on a distance metric and assigns similar data points to the same cluster. The distance metric and the method of updating cluster centres are one of the core concepts of K-Means cluster analysis and have a significant impact on the results of cluster analysis.
In this paper, we use the K-means clustering algorithm to classify the genres in the dataset into 10 based on the digital audio features of each genre, and the clustering results are shown in Figure 7.
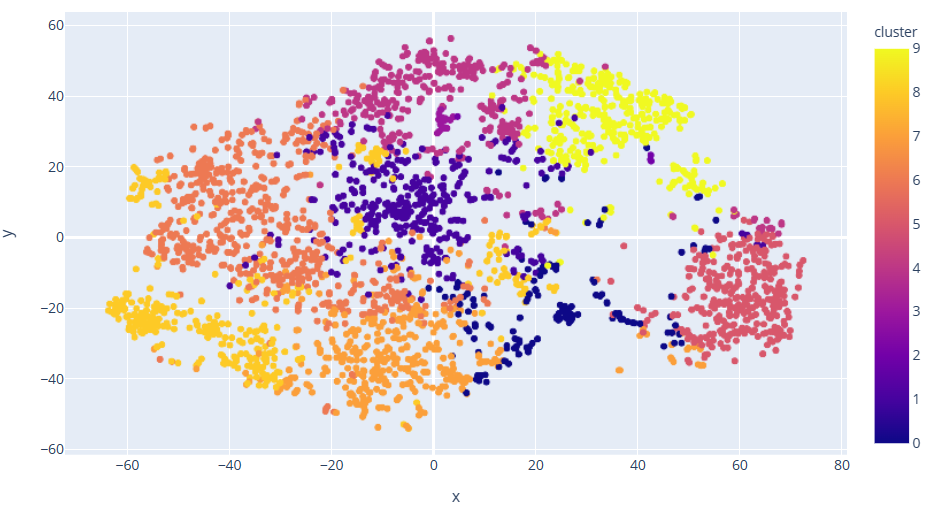
Figure 6. Cluster analysis chart.
(Photo credit : Original)
The songs were also clustered using K-Means and the results are shown in Figure 8.
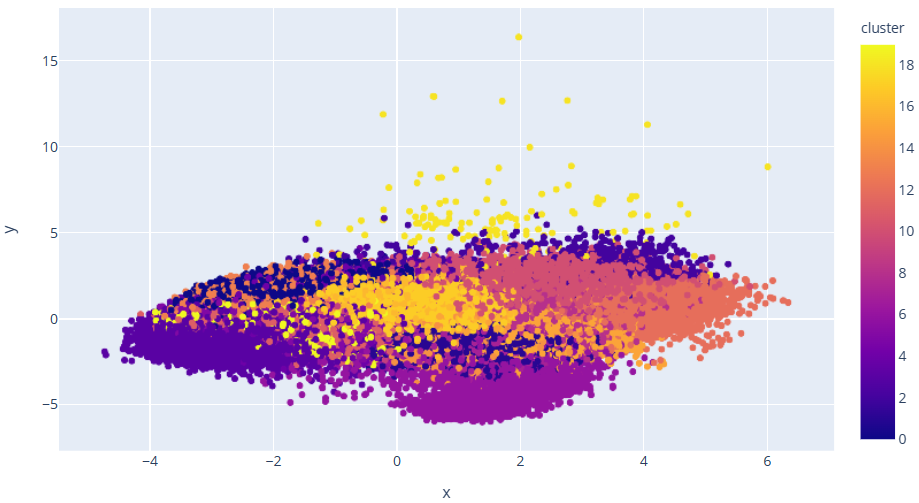
Figure 7. Cluster analysis chart.
(Photo credit: Original)
Based on the cluster analysis and visualisation, it is clear that data points of similar genres tend to be close to each other, and songs of similar types cluster together.
5. Building Recommender Systems
Music in similar genres sounds similar and comes from similar time periods, and the same is true for songs in those genres. We can use this idea to build a recommender system that recommends songs corresponding to nearby data points by obtaining data points of songs that the user has listened to, and the algorithm flowchart is shown in Fig. 9.

Figure 8. Algorithm flow chart.
(Photo credit: Original)
After establishing the model, input the music dataset, the system will automatically go to download the corresponding music according to the name of the input music data, followed by the extraction of the features of the music according to the indicators of sound, dance, energy, instrumental, liveliness, loudness, language, rhythm, mood, duration (milliseconds), and tone, and then according to the K-means clustering analysis, the synthesis of the authors and the type of music, to match the most in line with the tastes of the listeners of the five pieces of music, to the test of the system, and the input of the dataset as shown in Table 1, you can get the music recommendation as shown in Table 2.
Table 1. Input Song Collection. | |
serial number | name |
1 | Come As You Are |
2 | Smells Like Teen Spirit |
3 | Lithium |
4 | All Apologies |
5 | Stay Away |
Table 2. Recommended Song Collection. | |
serial number | name |
1 | Life is a Highway |
2 | Of Wolf And Man |
3 | Somebody Like You |
4 | Kayleigh |
5 | Little Secrets |
Through the combination and comparison of the difference weight mean fluctuation prediction obtained above, the predicted value of Ridge regression also conforms to the statistical law range of silica component content in Question 2, so the conclusion is verified to be correct.
6. Conclusion
This paper focuses on the construction and analysis of a music recommendation system, through visual and exploratory analysis of the open source dataset of the music recommendation system in the UCL database, exploring the relationship between music popularity and music acoustic characteristics, while using the K-means clustering algorithm for clustering analysis of genres and songs, and finally building a music recommendation system that can be used to match the user's input of music data, matching the ten music songs that best match the listener's taste.
From the analysis results of this paper, it can be seen that there is a certain correlation between music popularity and the indicators of sound effect, danceability, energy, instrumentality, liveliness, loudness, language, rhythm, mood, duration and tone. Among them, the indicators of energy, liveliness, loudness and tempo are positively correlated with the popularity of music, while the indicators of mood and duration are negatively correlated with the popularity of music. This suggests that popular music tends to have higher energy, liveliness, loudness and rhythm, while music with more complex emotions or longer duration is less likely to become popular.
In addition, this paper uses the K-means clustering algorithm for cluster analysis of genres and songs, which demonstrates the similarities and differences between different genres and songs through visualisation. Through the clustering analysis, we can clearly see that the data points of similar genres tend to be close to each other, and the songs of similar types are clustered together. This provides important data support for the construction of music recommendation system.
Finally, this paper establishes a music recommendation system based on the K-means clustering algorithm, which can match the ten songs that best meet the listener's taste according to the music data input by the user. The system can not only improve the user's listening experience, but also provide strong support for music promotion and sales. At the same time, the system also has certain intelligent and personalised features, which can recommend music works that are more in line with the user's taste according to the user's preferences and historical listening records.
In summary, the results of this paper show that the construction and analysis of the music recommendation system can explore the relationship between music popularity and music acoustic characteristics through the visual analysis and clustering analysis of music data, and establish an intelligent and personalised music recommendation system to improve users' listening experience and music sales performance.