

1. Introduction
1.1. Background
The issue of child obesity has been a longstanding global concern, especially in recent decades, witnessing an increase in rates in most middle-income and high-income countries. [1] As one of the developed nations, the UK grapples with the significant challenge of child obesity. To gain a deeper understanding of this issue and offer pertinent recommendations, this report will focus on the five boroughs of Ealing, Hammersmith & Fulham, Hounslow, Kensington & Chelsea, and Richmond in the UK. We will analyse and explore the relevant factors contributing to child obesity in these areas and propose corresponding recommendations based on the application of probability and statistical knowledge.
1.2. The Source of Data
Data name:London Ward Well-Being Scores
Author:Greater London Authority
Website: https://data.london.gov.uk/dataset/london-ward-well-being-scores
1.3. The Selection of Data and Samples
The areas I have chosen are Ealing, Hammersmith & Fulham, Hounslow, Kensington & Chelsea, and Richmond. This report has selected data from the year 2013 for the five selected boroughs in terms of ‘Child Obesity’, ‘Unauthorised Absence In All Schools’, ‘Dependent Children In Out-of-work Households’, and ‘Public Transport accessibility’. Each borough is treated as a separate sample.
2. Literature Review
R. Layte et al.'s research identified a correlation between socioeconomic factors during early childhood and certain outcomes. Their findings were instrumental in guiding the selection of variables for the study, providing valuable insights into the complex interplay between socioeconomic influences and child development. [1]
L. J. Ells et al, in their study, they found that government need to raise awareness of the prevalence of severe obesity and support the provision of adequate treatment and prevention services both to support children who are already severely obese and reduce the prevalence of extreme weight in the future. Their research provided background support for my research. [2]
S. B. Tan, He used hypothesis testing to look for differences in the influence of social environment on childhood obesity. His research has provided ideas on the research methods of difference. [3]
F. S. Corotto's introduction of the two-sample t-test has significantly advanced statistical analysis. This method offers a robust tool for comparing means between two groups, allowing researchers to assess differences with greater accuracy and determine their statistical significance. [4]
The paper by M. B. Schwartz and R. Puhl provides a comprehensive examination of the major challenges facing obese children and their families, contrasting the treatment and prevention of childhood obesity with other threats to American children's health. They underscore the prevailing notion that addressing childhood obesity is primarily the responsibility of individual children and their parents. Furthermore, by synthesizing multiple bodies of literature, the authors highlight the complex issues surrounding childhood obesity and advocate for a shift in societal thinking regarding its etiology, treatment, and prevention. Their study give me some opinions of choosing variables. [5]
The purpose of T. J. Lamerton, L. Torquati and W. J. Brown review and meta-analysis was to evaluate overweight and obesity as risk factors for urinary incontinence in young to mid-aged women. And though their study, they use some of the concepts of confidence interval to measured interval value of disease risk. The way they judge the value of risk also provides a lot of ideas for my calculation. [6]
3. Methodology
3.1. Study Aim
Applying probability statistics, I will analyze data from the UK boroughs of Ealing, Hammersmith & Fulham, Hounslow, Kensington & Chelsea, and Richmond to investigate the impact of schools, families, and societies factors on child obesity.
3.2. Study Objective
Objective 1: Explore the variability in child obesity rates across different regions.
Objective 2: Investigate the correlation between child obesity and schools, families, and societies factors.
Objective 3: Develop a linear regression model to analyze the relationship between child obesity and schools, families, and societies factors.
3.3. Variable Selection
Dependent variable: Child Obesity means children with a BMI greater than or equal to the 95th centile of the British 1990 growth reference (UK90) BMI distribution have been classified as obese.
Independent variables: At the school’s level, this report utilizes ‘Unauthorised Absence in All Schools’ data, representing non-attendance at school without permission. Such behaviour hampers the progress and effectiveness of students’ learning. Prolonged instances of this behaviour can significantly impact a student’s education. This report explores the connection between schooling and child obesity, employing the ‘Unauthorised Absence in All Schools’ data to assess children’s educational attainment across various boroughs.
In terms of families, this report focuses on the data of ‘Dependent Children In Out-of-work Households’. This is because out-of-work households may have certain economic problems, which may affect the diet quality of children in these households. Previous studies have shown that diet quality has an impact on child obesity. [3] Therefore, this report chooses ‘Dependent Children in Out-of-work Households’ data as a variable to explore the influence of families on child obesity.
In terms of social factors, the data selected here is ‘Public Transport Accessibility’. ‘Public Transport Accessibility’ refers to the accessibility of the area, such as the accessibility of transport, the type of transport and so on. Therefore, introducing this variable can help this report to explore the effect of social factors on child obesity. [3]
3.4. Overview of Research Methods
In terms of research methodology, this report chose to investigate regional differences in obesity based on the two-sample t-test. To study the reasons for these differences, this report judges the relationship between variables through the construction of the correlation matrix between variables. Then the linear regression model is used to construct the linear equation, and the accuracy and reliability of the equation are judged by the confidence interval.
3.5. Symbolic Assumption
Table 1. Symbolic Assumption
Symbol |
Interpretation |
Y |
Child Obesity (%) |
\( X_{1} \) |
Unauthorised Absence In All Schools (%) |
\( X_{2} \) |
Dependent Children In Out-of-work Households (%) |
\( X_{3} \) |
Public Transport accessibility (%) |
4. Data Analysis
4.1. Descriptive Statistics
The mean, variance, and standard deviation of the data were calculated using MATLAB. The total number of data is 95, and the following is a detailed description of the data.
Table 2. Descriptive Statistics
Borough |
Total |
Child Obesity |
Unauthorised Absence In All Schools |
Dependent Children In Out-of-work Households |
Public Transport Accessibility |
||||||||
mean |
var |
std |
mean |
var |
std |
mean |
var |
std |
mean |
var |
std |
||
Ealing |
23 |
21.0075 |
13.0996 |
3.6193 |
0.9154 |
0.0458 |
0.2141 |
17.5603 |
37.2409 |
6.1025 |
3.2974 |
0.4403 |
0.6635 |
Hammersmith & Fulham |
16 |
22.4675 |
19.9167 |
4.4628 |
1.1932 |
0.0302 |
0.1738 |
20.0193 |
61.0900 |
7.8160 |
4.6744 |
1.0637 |
1.0313 |
Hounslow |
20 |
22.7195 |
16.8477 |
4.1046 |
1.1244 |
0.0563 |
0.2373 |
17.3761 |
29.4159 |
5.4236 |
3.0106 |
0.6037 |
0.7770 |
Kensington & Chelsea |
18 |
21.2030 |
16.1828 |
4.0228 |
1.0492 |
0.1205 |
0.3471 |
12.7563 |
108.2582 |
10.4047 |
5.7943 |
1.0576 |
1.0284 |
Richmond |
18 |
11.7557 |
18.4058 |
4.2902 |
0.7840 |
0.0472 |
0.2173 |
7.0804 |
14.2222 |
3.7712 |
3.0466 |
0.5565 |
0.7460 |
4.2. Inferential Statistics
This report also plotted the histograms, density mass curves and Q-Q plots of the children to assess the normal distribution of child obesity data. The Q-Q image is judged on the basis that the closer it is to the center line, the more normal distribution it follows. The findings that the data approach to a normal distribution, justifying the subsequent use of a two-sample t-test for further analysis of child obesity.
4.2.1. Difference Analysis
In this report, we chose to analyse the differences between child obesity rates in five regions by applying the two-sample t-test in hypothesis testing. In the testing process firstly, these 5 regions were divided into groups of two by two, after which the two-sample t-test function was invoked through MATLAB to test the data of each two regions separately. In the detection process, the null hypothesis is set as no significant difference between the two samples. So, when the test result shows h=0 it means that the null hypothesis is accepted and there is no significant difference between the two samples. On the contrary, when the result is h=1, it means that the null hypothesis is rejected and there is a significant difference between the two samples directly.
|
|
Chart 2. Child Obesity Distribution |
Chart 3. Child Obesity Q-Q Plot |
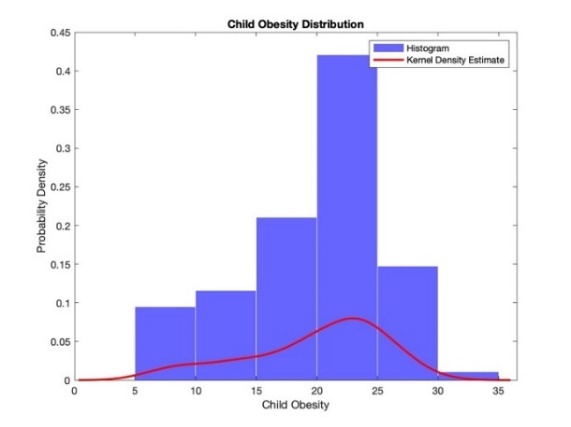
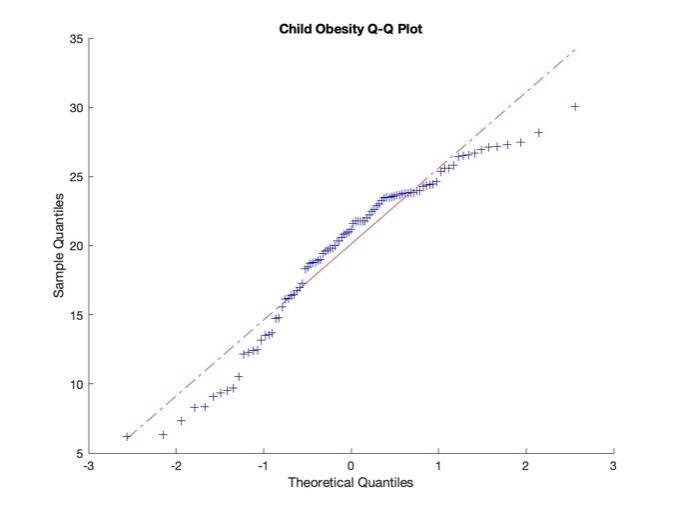
Table 3. Two Samples T-test
Hammersmith & Fulham |
Hounslow |
R B of Kensington & Chelsea |
Richmond upon Thames |
|
Ealing |
h =0 p =0.2674 ci =-4.0871 1.1672 tstat: -1.1260 df: 37 sd: 3.9829 |
h =0 p =0.1536 ci = -4.0904 0.6663 tstat: -1.4537 df: 41 sd:3.8518 |
h = 0 p =0.8710 ci =-2.6146 2.2237 tstat: -0.1634 df: 39 sd: 3.8005 |
h =1 p =4.6167e-09 ci =6.7529 11.7508 tstat: 7.4886 df: 39 sd: 3.9259 |
Table 4. Two Samples T-test
Hounslow |
R B of Kensington & Chelsea |
Richmond upon Thames |
|
Hammersmith & Fulham |
h =0 p =0.8612 ci =-3.1601, 2.6561 tstat: -0.1761 df: 34 sd: 4.2663 |
h =0 p =0.3913 ci =-1.6993, 4.2283 tstat: 0.8691 df: 32 sd: 4.2347 |
h =1 p =4.3055e-08 ci =7.6520, 13.7716 tstat: 7.1309 df: 32 sd: 4.3720 |
Table 5. Two Samples T-test
R B of Kensington & Chelsea |
Richmond upon Thames |
|
Hounslow |
h =0 p=0.2586 ci =-1.1627, 4.1958 tstat: 1.1480 df: 36 sd: 4.0662 |
h =1 p=1.4604e-09 ci =8.2008, 13.7268 tstat:8.0477 df:36 sd: 4.1933 |
Table 6. Two Samples T-test
Richmond upon Thames |
|
R B of Kensington & Chelsea |
h =1 p =7.6797e-08 ci =6.6302 12.2644 tstat: 6.8152 df: 34 sd: 4.1586 |
From the results presented in the table above, there are significant differences in the child obesity rates between Thames and Ealing, Hammersmith & Fulham, Hounslow, Kensington & Chelsea. In the next, the report will explore the reasons for this significant difference through research on schools, families, and societies.
4.2.2. Correlation Analysis
To better comprehend the reasons behind observed differences, this report conducts a correlation analysis between the independent variables of ‘Unauthorised Absence in All Schools,’ ‘Dependent Children in Out-of-work Households,’ and ‘Public Transport Accessibility,’ and the dependent variable of ‘Child Obesity’.
The correlation matrix =
1.0000 0.6098 0.0032 0.5748
0.6098 1.0000 -0.1862 0.6506
0.0032 -0.1862 1.0000 0.0837
0.5748 0.6506 0.0837 1.0000
The construction of the correlation matrix shows that a positive correlation is presented.
4.2.3. Establishment of Linear Regression Equations
To represent the relationship between the dependent and independent variables more clearly and establishing a linear regression equation.
Table 7. Estimated Coefficients
Estimate |
SE |
tStat |
pValue |
|
(Intercept) |
6.3201 |
1.9612 |
3.2227 |
0.0017632 |
Unauthorised Absence in All Schools |
5.0589 |
1.9077 |
2.6518 |
0.0094452 |
Dependent Children in Out-of-work Households |
0.36918 |
0.066434 |
5.5571 |
2.7086e-07 |
Public Transport Accessibility |
0.75307 |
0.31406 |
2.3978 |
0.018535 |
Number of observations: 95, Error degrees of freedom: 91
Root Mean Squared Error: 4.05
R-squared: 0.505, Adjusted R-Squared: 0.489
F-statistic vs. constant model: 31, p-value = 6.96e-14
Linear regression equation:
\( Y=5.0589 * X_{1}+ 0.36918 *X_{2}+ 0.75307* X_{3} \)
4.2.4. Confidence Interval Calculation
The estimation range of the parameters in the regression equation is given by calculating the confidence interval, to judge the significance and reliability of the model.
The 95% confidence interval=
2.4245 10.2158
1.2694 8.8483
0.2372 0.5011
0.1292 1.3769
The 99% confidence interval=
1.1604 11.4799
0.0398 10.0779
0.1944 0.5440
-0.0732 1.5794
The confidence interval refers to the estimated interval of the population parameter constructed by the sample statistics. From the fact that the 95% confidence interval of the regression coefficients does not include 0, it can be concluded that the estimated regression coefficients are significant. Therefore, the relationship between the independent and dependent variables exists and the model is reliable.
By comparing the solution of the two confidence intervals, it can be found that the 99% confidence interval is wider, so it is less likely to contain the real parameters, reflecting the higher uncertainty of the real parameters.
5. Conclusion and Outlook
5.1. Conclusion
From the studies on regional variability, significant differences in child obesity rates were observed among certain regions. Also based on schools, families, societies factors and child obesity correlation study found that there is a correlation between all three factors and child obesity.
‘Unauthorised Absence in All Schools’ is a behaviour that affects the progress and effectiveness of learning, and children in this group may be missing out on learning about health issues such as the reason leading to obesity. ‘Out-of-work Households’ may be financially constrained in terms of dietary expenditure, and this may result in children not being able to consume good quality protein, making them more vulnerable to obesity. ‘Public Transport Accessibility’ is positive for society, but it is important to note that the more accessible the transport, the more likely children are to be physically inactive in their daily lives, which can have an impact on their health.
Indeed, an analysis of the data reveals a notable coefficient for ‘Unauthorised Absence in All Schools’ within the linear equation. This high coefficient may stem from students frequently being absent will prevent the school from providing timely BMI information to parents. Furthermore, the UK’s leave of absence system necessitates parental or student applications in advance, and unexcused absences can signify parental irresponsibility, indicating a potential lack of attention to child obesity. In addition, without having physical activity in school just staying at home, may also cause these children to become obese.
This report also presents several suggestions to address the issue of child obesity. Firstly, schools should enhance the supervision of students with unauthorized absences and maintain regular communication with their parents. Secondly, the government should prioritize out-of-work households and implement corresponding subsidy policies to support the healthy development of children in these households. Thirdly, schools should consider increasing the exercise for students, for example by increasing extracurricular sports activities to further reduce child obesity caused by insufficient physical activity.
5.2. Outlook
In future studies, this report aims to enhance objectivity by including more regions. Additionally, the report seeks to broaden the investigation into factors influencing child obesity by expanding the number of variables. This approach aims to provide more practical recommendations for addressing the issue of child obesity.