


1. Introduction
Over the past few years, due to the improvement of people's living standards and the ongoing progress in medical technology, an increasing number of individuals have started to focus on their health condition. However, earlier versions that merged the human cardiovascular and respiratory systems did not adequately account for their robust dynamic interplay [1]. Among them, monitoring and analysis of biological signals such as pulse wave, blood oxygen and respiratory wave have become important means of health detection. However, these biological signals are often affected by many factors. Factors such as exercise and environment can cause signal noise and interference, which poses great challenges to signal analysis and processing. In order to better process the data of these biological signals and improve the quality and reliability of the signals, this study has developed a set of data monitoring and noise reduction analysis programs for pulse wave, blood oxygen and respiratory wave using MATLAB. The program can perform noise reduction processing on the collected biological signal data and perform filtering, analysis, and visualization processing on the signal, achieving comprehensive monitoring and analysis of biological signal data. The main research content of this paper is the data monitoring and noise reduction analysis methods for pulse wave, blood oxygen and respiratory wave.
Through the research of this paper, it hopes to provide more comprehensive and accurate methods for monitoring and analyzing biological signals, improve the quality and reliability of biological signal data, and provide better protection for people's health.
2. Methodology
2.1. Theory
Detection principle of photoplethysmography (PPG) signal. The photoplethysmography (PPG) method records the pulse wave by emitting green light from an LED in the PPG sensor. Thus, the tissues and arteries and veins were passed through by the light from the LED under the skin and the light is absorbed and reflected to the photodiode (PD) [2]. Absorption of light by tissues such as muscle, bone, veins, and other connecting tissues is basically constant (assuming that the measurement site is not subject to significant movement), but blood flow is different. The absorption of light naturally changes due to the flow of blood in the arteries, resulting in DC and AC components when converting light to an electrical signal. While the absorption of light by other tissues remains constant, the AC component reflects the characteristics of blood flow. Blood oxygen saturation is measured using Lambert-Beer's law, also called the basic law of light absorption, where the absorbance of a uniform non-scattering absorbing substance is directly proportional to both the concentration and the thickness of the absorbing layer, but inversely proportional to the transmittance when a parallel monochromatic light passes through it vertically [3, 4]. This is the principle of the dual-wavelength measurement method. Its conformity with Lambert-Beer's law, the result of the light absorbed by blood is with plenty of variety which is caused by the proportion of oxygenated hemoglobin, but the absorption of light by skin is constant. (3) Frequency Modulated Continuous Wave (FMCW) ranging principle [5]. The figure below shows a millimeter-wave radar emitting a linearly frequency-modulated pulse to the chest area of a patient. Due to chest movement, the reflected signal is phase-modulated, covering all components of motion, including those caused by heartbeat and breathing. Millimeter-wave radar with a frequency of 60 or 77 GHz (corresponding to wavelengths within the range of 4 mm) can detect movement as short as less than 1 mm. The radar sends multiple linearly frequency-modulated pulses at predetermined time intervals. Each pulse undergoes a distance fast Fourier transform (FFT) and selects a distance bin corresponding to the position of the patient's chest. The signal phase in the selected distance bin is recorded for each linearly frequency-modulated pulse. Phase changes are then calculated to obtain velocity, which still includes all motion components. By performing a Doppler FFT on the obtained velocity for spectral analysis, various components can be resolved.
Brief Introduction to the cardiopulmonary system. The human body's crucial systems that collaborate to provide oxygen to the tissues and organs and remove carbon dioxide are the cardiovascular and respiratory systems. The cardiovascular system is comprised of blood vessels and the heart, and the respiratory system comprises the respiratory tract and lungs. The cardiopulmonary system is consisted by two parts, which are the cardiovascular system and the respiratory system. The heart circulates blood via the arteries, veins, and capillaries to supply oxygen and nutrients to the body's tissues, whereas the lungs perform respiration to exchange oxygen and carbon dioxide. When it comes to observing the systems, there are three important features that need to be considered, which are the pulse wave, blood oxygen and respiratory wave.
3.1. Research design
The overview of measuring the cardiopulmonary system. The pulse wave is a pattern of pressure changes in the arteries that occurs with each heartbeat. When the heart contracts, it pushes blood into the arteries, which makes the expansion of the wall of the arteries. when the heart stop beating, the wall of arteries rebound. This pressure wave is transmitted through the arteries, and we can measure it by feeling the pulse at different locations on the body [6].
The value of blood oxygen is depending on what is the number of red blood cells which are carrying oxygen in the blood, which is usually expressed as oxygen saturation or SpO2 percentage. Normal blood oxygen saturation in healthy individuals is typically between 95% and 100%, and if it drops below 90%, it is considered low blood oxygen levels [7], it can lead to symptoms such as shortness of breath, fatigue, and confusion or sleep apnea [8].
Respiratory waves refer to specific physiological signals produced by the movement of the chest and abdomen during the human respiratory process, which is a waveform signal generated by the expansion and contraction of the lungs and chest. The measurement and analysis of respiratory waves can be used for diagnosing and monitoring a variety of respiratory diseases [9].
The design of the signal measurement and date testing. The experiment aims to investigate a sample of healthy adult, the participant will be asked to sit still in front of the sensor and wear a heart rate monitor, a blood oxygen tester and a respiratory wave monitor during the test tasks to measure the date of cardiopulmonary system for 3 minutes. And the measurement of the signals and the collecting of the date will last about 5 minutes, and the examinee will be asked to stay still to avoid the disturbance to the experiment.
The prediction of the experiment. Based on previous studies, it is predicted that the experiment will tell us the normal blood oxygen, the heart rate, the respiratory frequency of the examinee. And the times of heartbeat can be measured by manual operation, it could be used as a reference of the result. However, the manual measurement is not accurate and the original data that the equipment received is also imprecise, there is a lot of interference from the environment that we must alleviate them. By using MATLAB to process the date, it can gain the time-domain waveform and FFT conversion diagram of the respiratory wave, as well as the time-domain waveform and FFT conversion diagram of the heartbeat signal. After using filtering technology, if the result is close to the pretest, it will show the accurate information about the cardiopulmonary system of the examinee, and the result will give a new way to observe the cardiopulmonary system.
Pretest. Before the experiment, this study manually measures the times of the heartbeat and breath of examinee, and it could be the reference of the test result:
Times of heartbeat: 98 times
Times of breath:23 times
Experimental procedures.
(1) JFH141 smart health monitoring module [10]:
①Connect the module to a computer via USB interface.
②Install the driver for the module on the computer.
③Use the health monitoring system to collect personal health information.
④Open the serial port assistant to obtain real-time data packets.
⑤Analyze and process the real-time data packets using MATLAB. Convert the binary data packets to signed decimal data packets, extract the heart rate data, and plot a scatter plot to obtain the pulse wave waveform.
⑥Identify the peaks and valleys of the waveform and obtain heart rate and blood oxygen saturation data.
(2) R60ABD1 respiratory sleep radar
①Connect the radar module to the computer via the specified wiring connections in the user manual and plug in the USB interface.
②Open the serial port assistant to check if the received data is normal.
③Ask the subject to sit in front of the radar and remain still for 30 seconds while the observer watches the radar waves and records the serial port data.
④Import the serial port data into MATLAB for analysis, extract the respiratory wave data according to the user manual.
4.1. Data collection
| ||
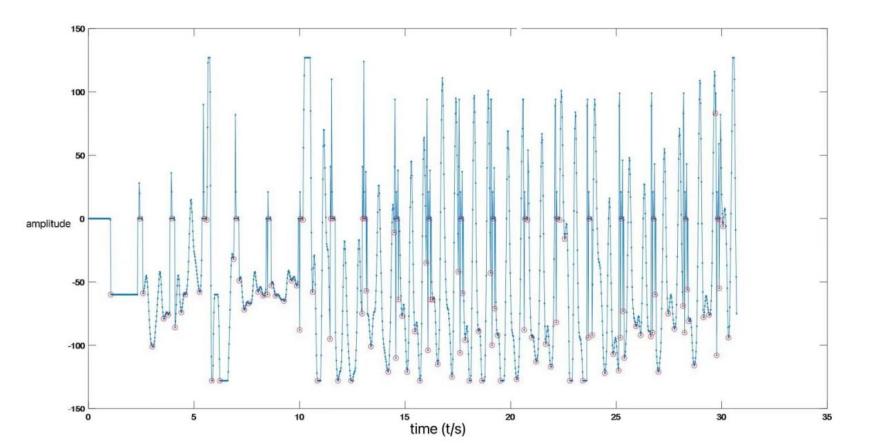
Figure 1. Heart rate. | ||
|
| |
Figure 2. Breathing wave with 1 chirp. | Figure 3. Time domain waveform of heartbeat. | |
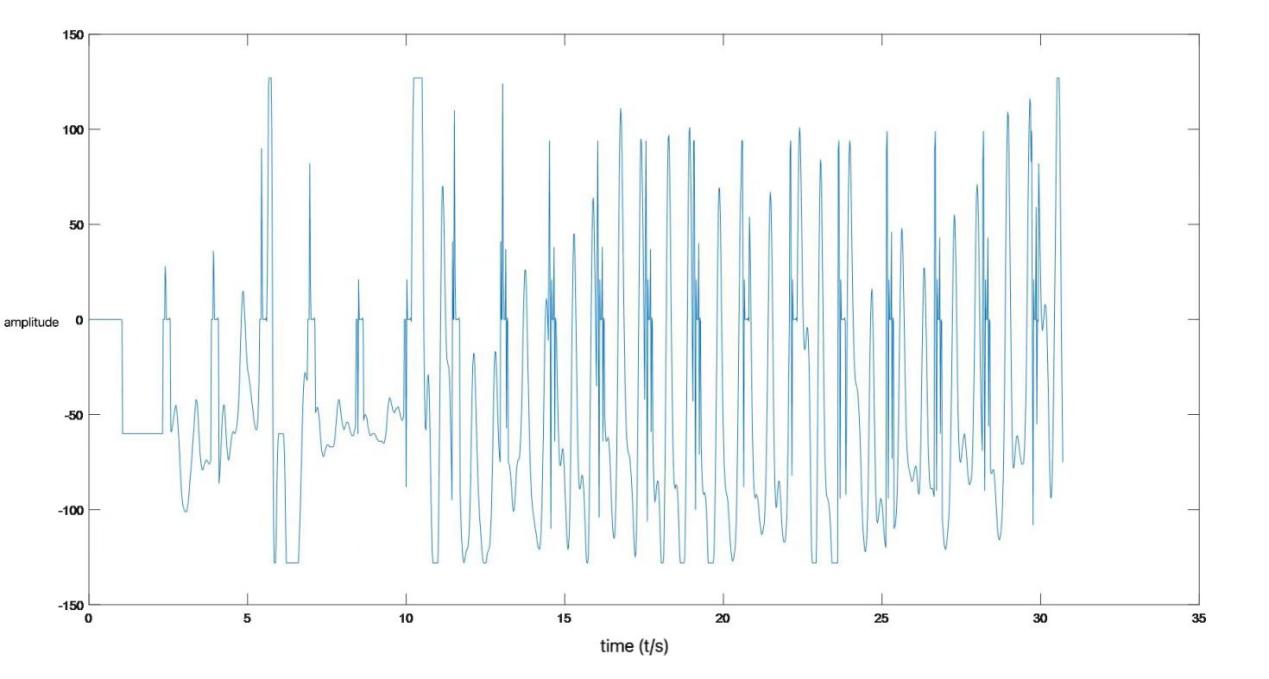
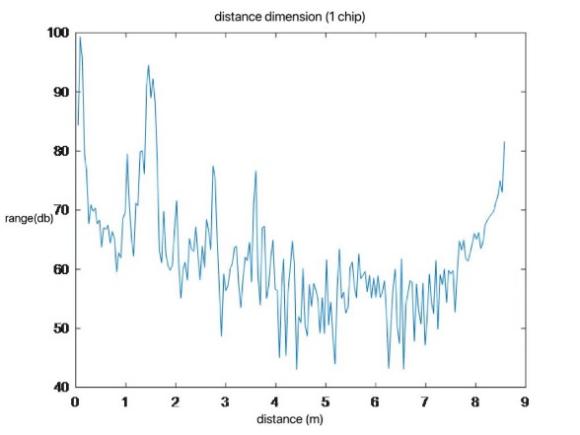
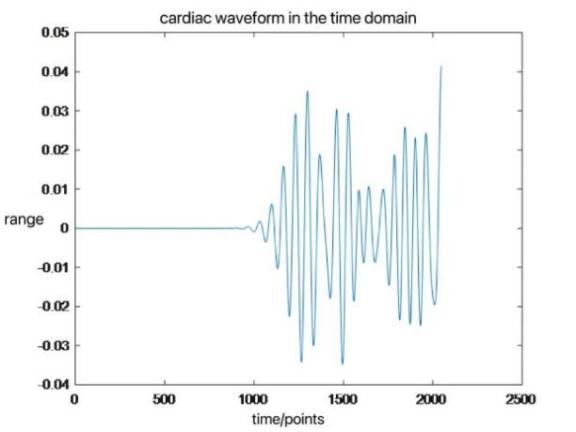
The experiment shows us the heartbeat data, it can be clearly seen from Figure 1 that there is periodic variation over time. But only from this figure it could not demonstrate the accurate heart rate directly, so it should write lines of code to get the peaks and valleys to calculate the average. Simultaneously, the waves of respiratory and heartbeat, which shown in Figure 2 and Figure 3, are also interfered by the noise from the environment, and FFT could deal with this situation.
5.1. Data processing
| ||
Figure 4. Peak identification. | ||
| ||
Figure 5. Valley identification. | ||
|
| |
Figure 6. Time-domain waveform of the respiration signal. | Figure 7. FFT of the Respiratory Wave. | |
| ||
Figure 8. FFT of the heartbeat signal. | ||
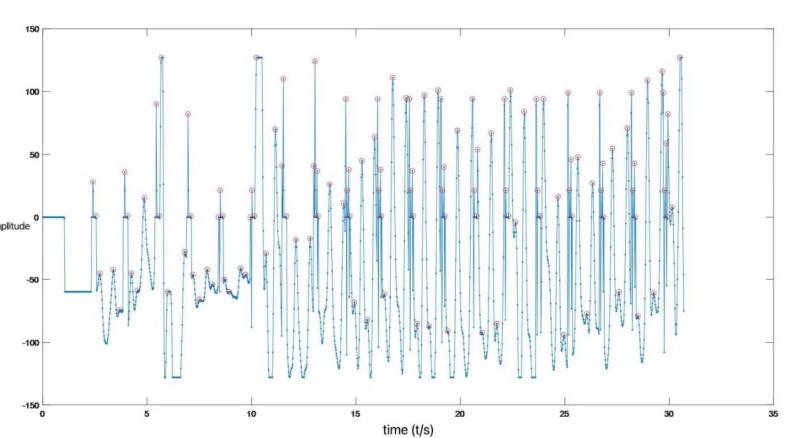
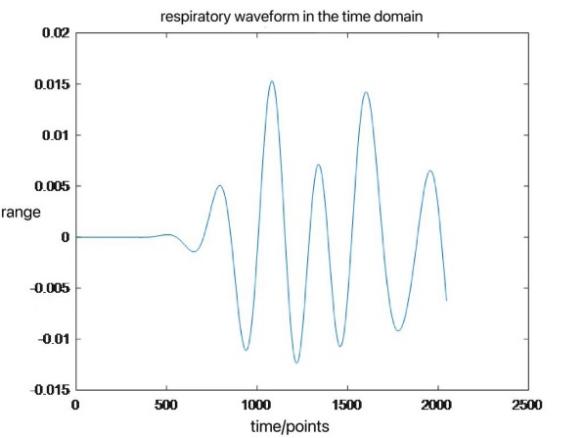
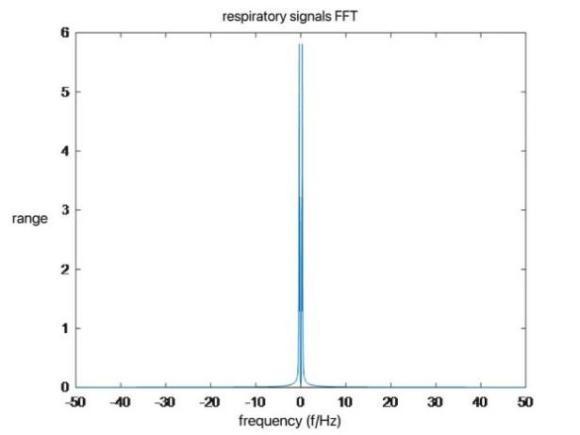
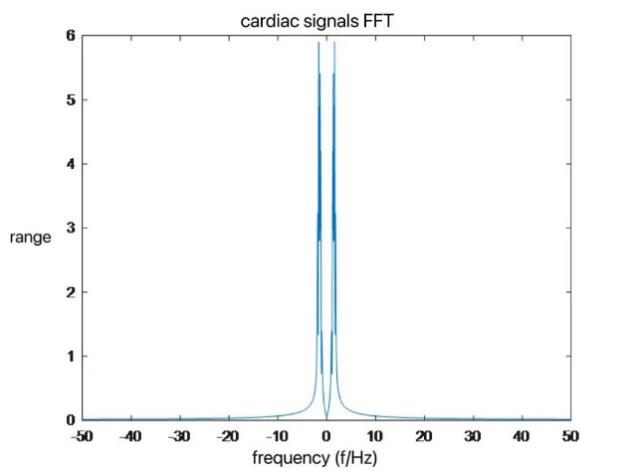
After using the MATLAB to recognize the Peaks and Valleys, which are shown in Figure 4 and Figure 5. It calculated the average heart rate and blood oxygen saturation. FFT conversion diagram of the respiratory wave, as well as the time-domain waveform and FFT conversion diagram of the heartbeat signal, are shown in Figure 6 to Figure 8, and it can remove the interference of the raw data and shows the accurate result of the experience.
3. Results
The data process calculates the average heart rate and alleviates the interference from the environment of the raw data by using the FFT, and it shows the number of heat rate is 101.373 per minute and the oxygen saturation is 99%, the respiratory frequency is 23.4375 per minute and the heartbeat frequency is 99.6094 per minute, the result of the experience is close to the pretest, so it can reflect the actual identification of the examinee’s cardiopulmonary system, and it give a new perspective of measurement in human cardiopulmonary system, and it could be much more accurate than measure it manually.
4. Conclusion
Through this practical operation, this study gained the following information: Firstly, after learning the basic information and concepts about optics, physiologic and date analysis, this experiment was be designed. During the experiment it conducted data collection by using the JFH14 intelligent health monitoring module driver configuration and R60ABD1 respiratory sleep radar. It provided us the data to use serial port assistant to collect real-time data packets and MATLAB for data parsing, converting pulse wave signals from hexadecimal to their original signed decimal values. By using the function of MATLAB, it drew heart rhythm waveform data, monitored waveform peaks and valleys, and calculated heart rate and blood oxygen saturation data from the data packets. Finally, the real-time data packets were parsed, simultaneously the respiratory wave data and the heart beat data were both obtained successfully. The time-domain waveform and FFT conversion diagram of the respiratory wave, as well as the time-domain waveform and FFT conversion diagram of the heartbeat signal, were also be successfully imposed as the diagrams. By using the technology of the data visualization, it can help the researchers to observe the cardiopulmonary system of the patients directly, give a new perspective of measurement in human cardiopulmonary system, and providing a fresh viewpoint on measuring the human cardiopulmonary system, which has the potential to be significantly more precise than manual measurement.
During the above experimental design, signal detection, and data analysis, during the first data collection process, due to unfamiliarity with the operation and unfamiliarity with the measurement specifications, there were problems with the subject's wearing of the equipment, resulting in errors in the measurement of blood oxygen saturation data. it shows that the data collection should be done under soft lighting, and there should be no movement during data collection, and the examinee should try to maintain a calm and quiet state to prevent too much noise interference in the data.