

1. Introduction
As a result of ongoing progress in enhancing people's quality of life, people use cars frequently in their daily lives at this stage. They have become an essential means of transportation for people to travel [1], making my country's automobile industry develop rapidly in recent years. It has gradually become a pillar industry in developing the national economy [2]. It has made outstanding contributions to promoting the positive growth, social employment, and improving people's livelihood and well-being [3]. Still, while improving people's living conditions, automobiles also have produced air pollution, environmental hazards, etc. Regarding problems, automobile pollution has become one of the sources of urban air pollution and ecological environment deterioration [4]. According to data from 2019, the nation's total motor car emissions of four contaminants were estimated initially to reach 16.038 million tonnes. They released 7.716 million tonnes of carbon monoxide, 1.892 million tonnes of hydrocarbons, 6.356 million tonnes of nitrogen oxides, and 74,000 tonnes of particulate matter [5]. The four principal contaminants emitted by vehicles, monoxide, hydrocarbons, nitrogen oxides, and particulate matter, are responsible for most of the overall pollutant emissions [5]. It is imminent to solve the environmental pollution caused by automobiles. Currently, one strategy for reducing pollution is to promote new energy vehicles. The total life cycle carbon emission of China's automobile industry has reached 1.2 billion tons, of which passenger vehicles account for about 58%. Blade Electric Vehicles have reduced carbon emissions (43.4%) compared to traditional gasoline vehicles [6]. As we all know, China could only have become a significant auto power with the development of new energy cars. It was a calculated move to combat climate change and advance sustainable development. However, as of the end of September 2022, there were 412 million motor vehicles in the nation, of which 315 million were vehicles, while the number of new energy vehicles in China reached 11.49 million, making up only 3.65% of the total [8]. At the same time, the export volume of China's new energy vehicles was relatively small, and as some core components were to read entire total assets, the international competitiveness of China's new energy vehicles still needed to be improved [9].
China's economic growth is changing from the accelerated growth cycle in the past to the economic adjustment cycle. Whether my country's economy can get out of the insufficient effective demand and excess production capacity and enter a new acceleration process depends mainly on forming a new industry driving force [10]. China's government has developed several incentive policies and industrial plans to promote the growth and development of the new energy automobile industry, optimize and upgrade the automobile industry, and achieve the transformation from a big country in the automobile industry to a strong nation in the automobile industry [11]. However, at present, most of the car sales in my country are still traditional fuel vehicles. The government has repeatedly advocated for people to buy new energy vehicles, but the effect is insignificant for various reasons. The clean energy automobile exhibition industry will establish the direction and objective of the continued development of the car industry in light of the need to reduce air pollution and the current global energy deficit [4]. A mutual connection, influence, and restriction between demand and supply are dynamic [12]. Therefore, this paper analyzes the collected data through SPSS to find out the factors that affect the sales and sales of the automobile industry, which will help the government or enterprises to take measures to actively adjust the strategy to make more and more people buy new energy vehicles to pull the demand to boost the development of the new energy vehicle industry rapidly. This will promote the research and development of new energy vehicles in China, break through the core technology, continue to drive China's rapid economic growth, and significantly reduce the pollution of the environment from vehicle emissions.
Zhang Xinxin and Wang Liu proposed a method that concluded that the consumer confidence index and disposable income of urban residents have a significant effect on automobile sales and analyzed the economic significance of the overall model. This paper concludes that automobile production and GDP significantly affect automobile sales in China. However, there are only five dependent variables in their paper: interest rates on automobile consumer credit, net income of rural residents, disposable income of urban residents, consumer confidence index, oil prices, and policy factors. This paper changes the dependent variables and expands to six. Wei concluded that many factors promote car sales, and most dependent variables are highly correlated. The results are analyzed, and a conclusion is given [14]. His article used SPSS principal component analysis method to test the correlation of independent variables and used dimensionality reduction to obtain regression equations. This paper uses SPPSPRO and SPSS multiple linear regression analysis to prove the existence of various correlations in separate variables. It uses SPSSPRO stepwise regression and ridge regression to calculate the K value to obtain the parameters of the equation and, at the same time, change the dependent variable. Zhao Ying wrote the five-part research structure is adopted, which is a review of the research background, the theoretical basis of automobile sales forecasting, the main factors affecting my country's automobile sales, the analysis of the aspects of China's automobile sales, and the analysis and summary of the data [15]. This paper mainly adopts a four-part research structure, which describes the research background and significance, discusses the factors affecting automobile sales, establishes a model and analyzes the model results, and solves the problem of multiple correlations of independent variables. The regression formula and suggestions for new energy vehicle sales are received.
The research goal of this paper is to use automobile production, ownership, oil consumption, road mileage, GDP, and gross national income as independent variables and automobile sales as dependent variables. With the help of SPSS and SPSSPRO, a model is established, and the results are obtained. Combined with the current situation, it provides reasonable suggestions for promoting the sales of new energy vehicles to stimulate economic growth and technological innovation and reduce air pollution.
2. Methodology
2.1. Variable Selection
At the same time, when people have cars available, they probably don't need to repurchase them, which will affect the production of vehicles, so the second indicator is car ownership. Currently, most of the world's cars still use oil as fuel, so oil production will be an essential factor restricting car sales. However, due to poor statistics, oil consumption is directly used as a research indicator. People use cars to travel, and roads are the cornerstone of car travel. Therefore, it is necessary to select road length as an indicator for research.
As we all know, the most intuitive indicator to reflect a country's economic situation is its gross domestic product. The automobile industry has always been the backbone of the national economy. As a result, the gross domestic product also influences the selling of cars.
In China, the automobile industry is developing rapidly, but unlike other daily necessities, automobiles are often compared to valuables such as houses. One of the important reasons is that car prices are relatively high. Therefore, people's purchase of automobiles is closely related to family and personal income. To ensure the correctness of dependent variables, it is advisable to choose the Statistical Yearbook with consideration for China's gross national income.
The data this time is mainly from 2006-2016. According to the National Statistical Yearbook, China's population growth rate is slowing down. Therefore, factors such as population and family population will also affect car sales. In addition to the above factors, some critical influencing factors, such as car prices, will also impact car sales, government policies' effects on auto sales, and public transportation expansion. Since this study has many dependent variables, the variables may need to be tested for correlation. At the same time, more explanatory variables may be required to ensure accurate model results. Therefore, the indicators mentioned above are selected for research using SPSS. The variables are shown in Table 1.
Table 1: Data description.
Type | Variable name | Detailed description | Ranges |
Dependent | car sales | quantitative | 721~2802 |
car production | 10,000 vehicles | 727~2811 | |
car ownership | 10,000 vehicles | 5000~19500 | |
oil consumption | million tons of standard coal | 501~825 | |
Independent | road mileage | 10,000 kilometers | 345~469 |
GDP | 100 billion yuan | 219~746 | |
Gross national income | hundreds of dollars | 210~584 |
2.2. Descriptive Analysis
From 2006 to 2016, the data on China's car sales, car production, car ownership, oil consumption, road mileage, GDP, gross national income, and other data are shown in Table 2.
Table 2: Changes in automobile sales and other influencing factors from 2006 to 2016.
years | Car sales | Automobile production | Car ownership | Oil wastage | Highway mileage | GDP | Gross national income |
2006 | 721.60 | 727.97 | 5000 | 501.32 | 345.7 | 219.44 | 210.01 |
2007 | 879.15 | 888.24 | 5700 | 529.45 | 358.37 | 270.09 | 249.32 |
2008 | 938.05 | 934.51 | 6500 | 535.42 | 373.02 | 319.25 | 265.23 |
2009 | 1364.48 | 1379.1 | 7600 | 551.25 | 386.08 | 348.52 | 284.62 |
2010 | 1806.19 | 1826.47 | 9100 | 627.53 | 400.82 | 412.12 | 306.87 |
2011 | 1850.51 | 1841.89 | 10600 | 650.23 | 410.64 | 487.94 | 357.07 |
2012 | 1930.64 | 1927.18 | 12000 | 683.64 | 423.75 | 538.58 | 419.29 |
2013 | 2198.41 | 2211.68 | 14000 | 712.92 | 435.62 | 592.96 | 478.69 |
2014 | 2349.19 | 2372.29 | 15400 | 741.02 | 446.39 | 643.56 | 531.01 |
2015 | 2459.76 | 2450.33 | 17500 | 798.77 | 457.73 | 688.86 | 561.41 |
2016 | 2802.8 | 2811.9 | 19500 | 825.59 | 469.63 | 746.40 | 584.75 |
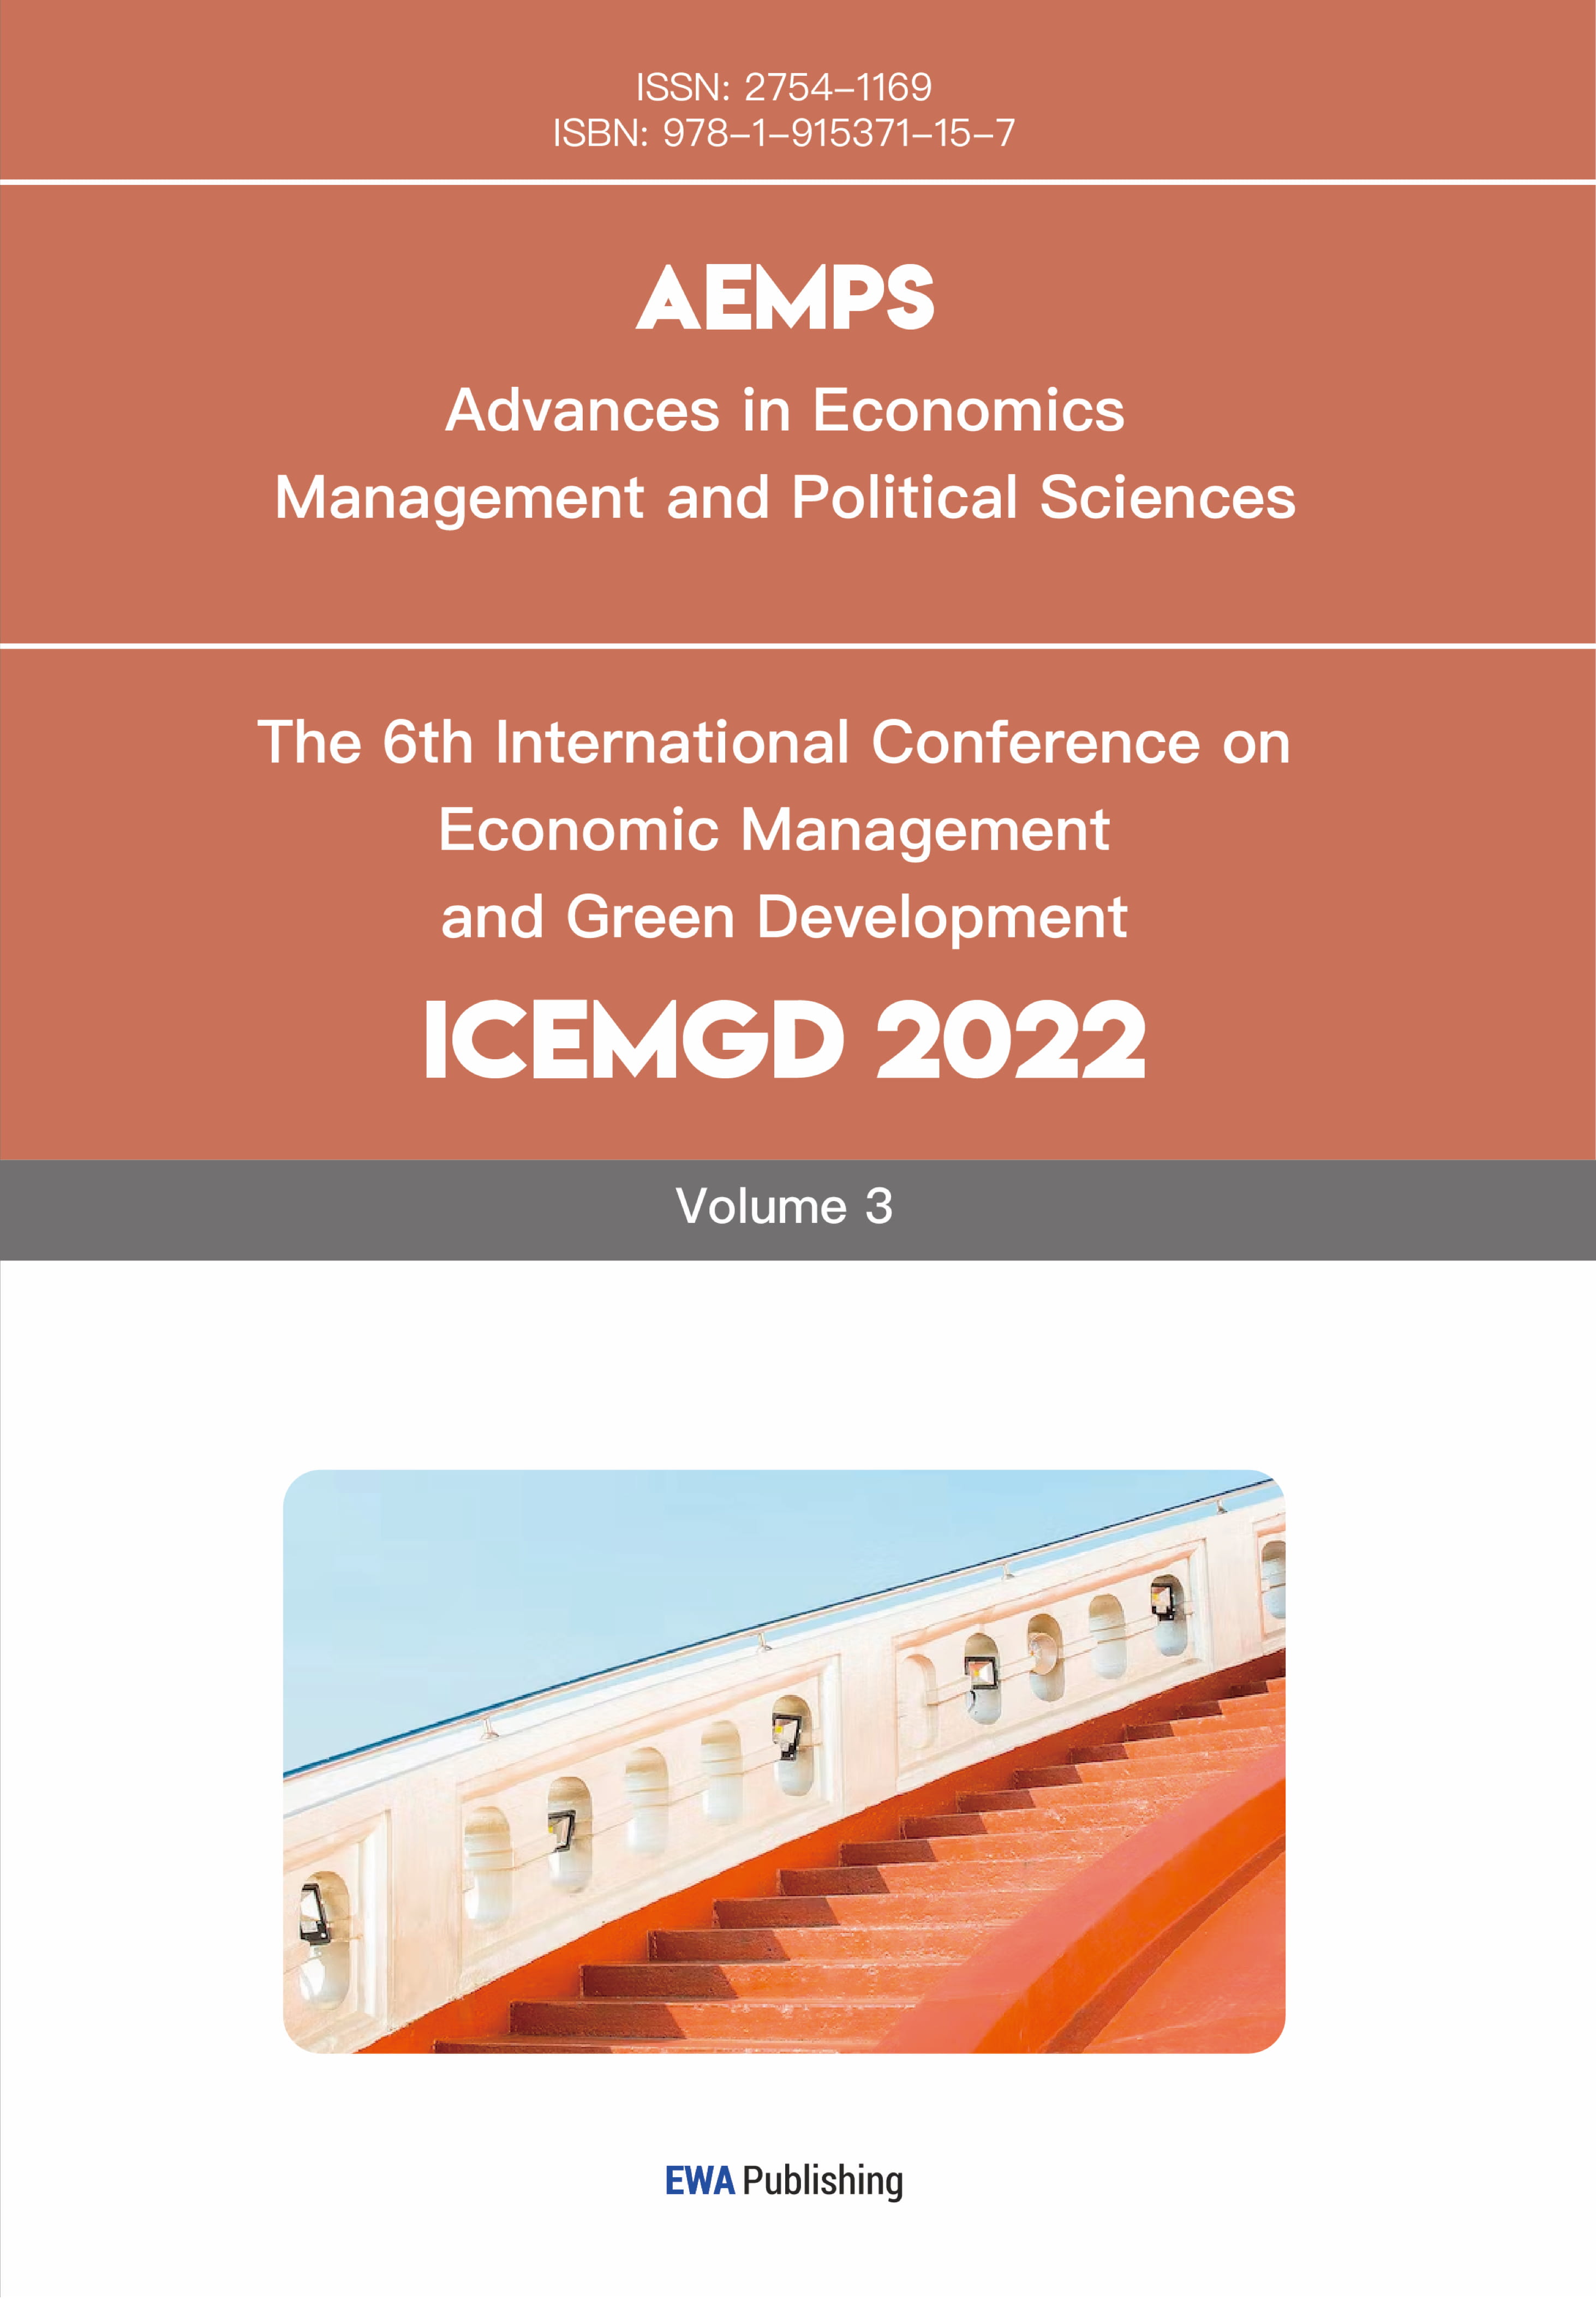
Before using SPSS software to build a model, this paper uses the data from 2006 to 2016 in the above table to calculate the relationship between car sales and car production, car ownership, oil consumption, road mileage, GDP, and gross national income. Doing a scatter plot (see Figures 1, 2, 3, 4, 5, and 6) to observe the general trends of these variables to choose an appropriate model.
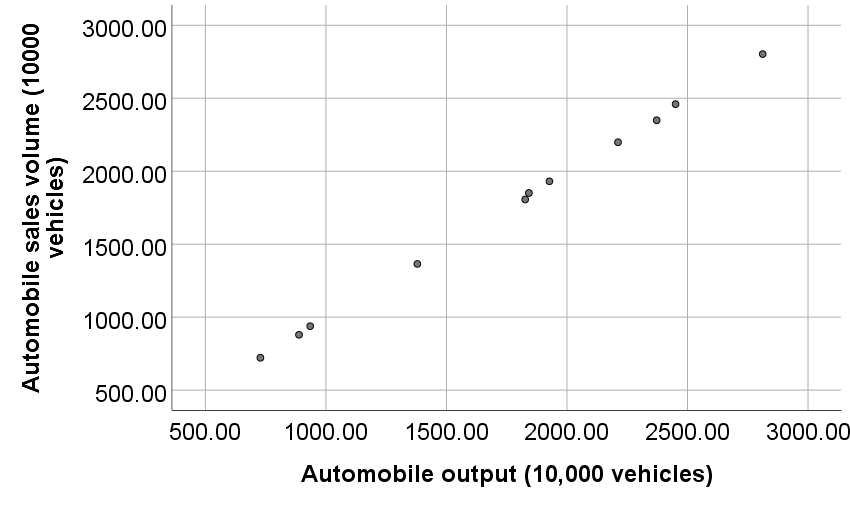
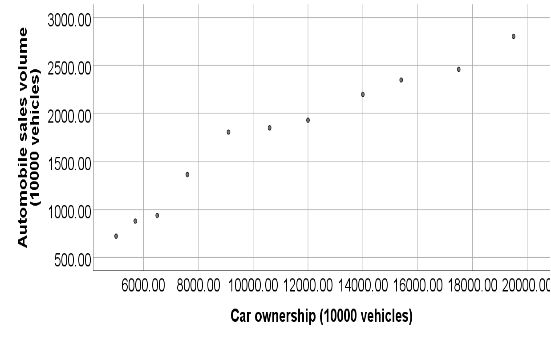
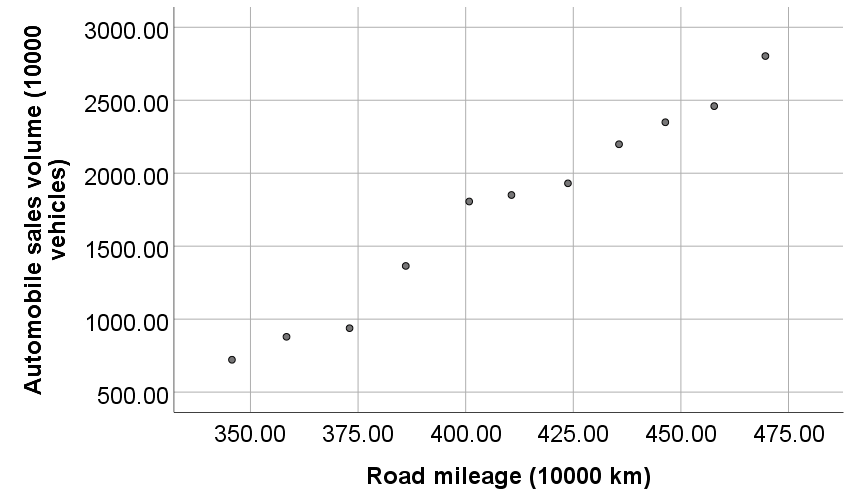 Figure 1: Relationship between automobile sales volume and automobile output, and automobile sales volume car ownership.
Figure 2: Relationship between automobile sales and oil consumption, automobile sales and highway mileage.
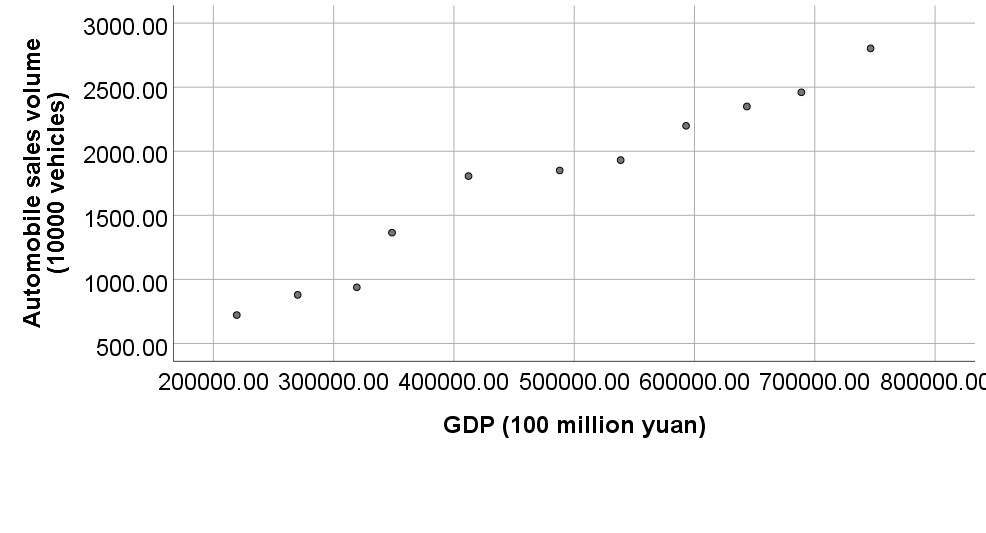
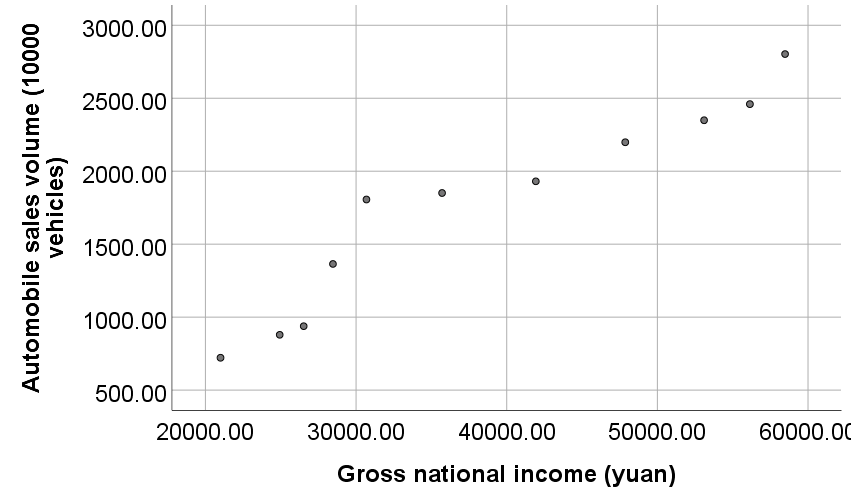 Figure 3: Relationship between automobile sales and GDP, automobile sales, and gross national income.
Based on the results, a possible linear relationship between car sales and the respective variables was found, and a multiple linear regression analysis was performed.
The linear regression model equation for establishing car sales and explanatory variables is as follows:
\( Y={β_{0}}+{β_{1}}{X_{1}}+{β_{2}}{X_{2}}+{β_{3}}{X_{3}}+{β_{4}}{X_{4}}+{β_{5}}{X_{5}}+{β_{6}}{X_{6}}+ε \) (1)
Among them, Y is the sales volume of automobiles, and X1, X2, X3, X4, X5, and X6 are the automobile production, automobile ownership, oil consumption, road mileage, GDP, and gross national income, respectively.
3. Results and Discussion
This paper uses SPSS to carry out the multiple linear regression model, conduct the independent variable correlation test, and discuss the results.
3.1. Model Results
Table 3: Model Summary.
Model | R | R square | Adjusted R-square | Quasi-estimation error | Durbin Watson |
1 | 1.000a | 1.000 | 1.000 | 7.13708 | 3.167 |
Notes: a. Predicted variables: (constant), gross national income (100 yuan), automobile production (10,000 units), oil consumption (million tons of standard coal), road mileage (10,000 kilometers), car ownership (10,000 units), GDP (100 billion yuan)
b. Dependent variable: car sales (10,000 units).
According to the Durbin-Watson value of 3.167 in the range of 2-4, it can be seen that the residuals have no autocorrelation and are independent of each other.
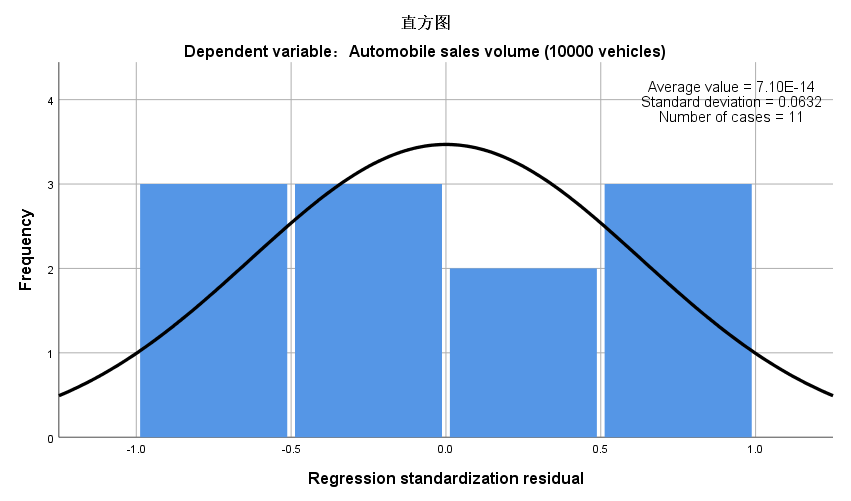
Figure 4: Histogram of residuals.
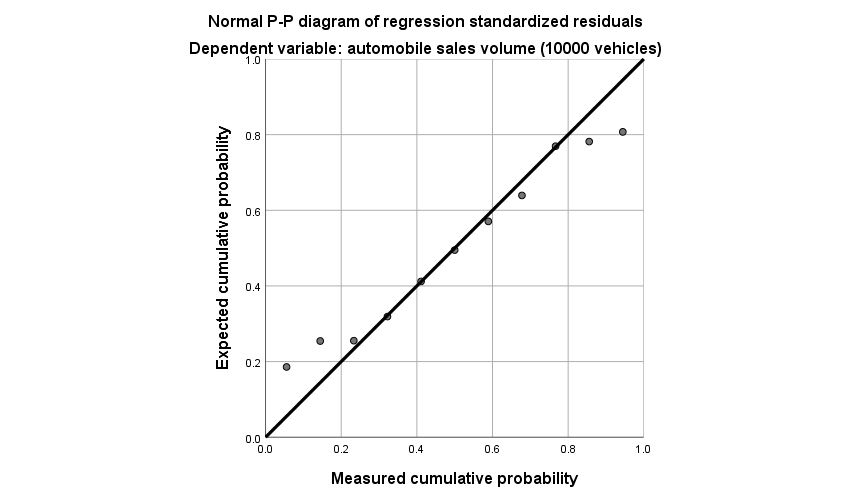
Figure 5: Normal P-P diagram of standardized regression residuals.
According to the residual histogram and the standard P-P chart, the actual observed scatter is close to the empirical cumulative expected probability line, and a normal distribution of the residue can be noticed.
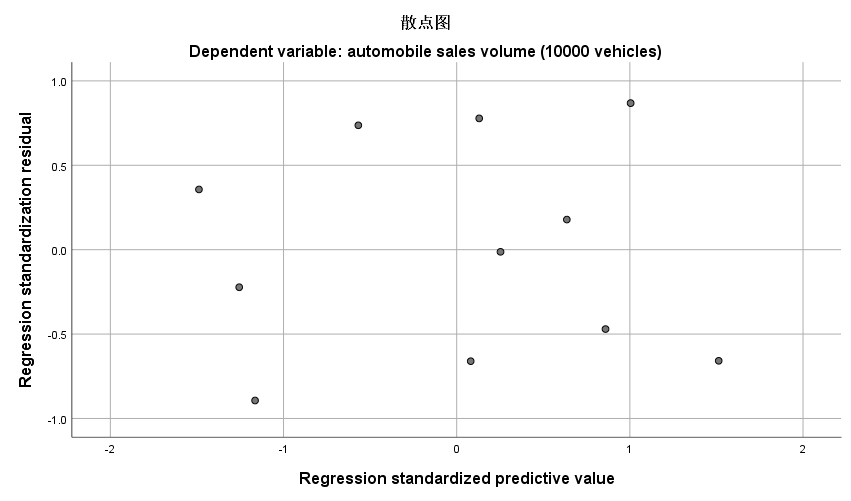
Figure 6: Scatter plot.
According to the residual diagram, the standardized residuals under different dependent variables are randomly distributed on both sides of the zero line, with no outliers. It can be seen that the residuals and variances are stable. To sum up, it can be seen that the residuals are independent and regular, and the conflict is challenging.
Table 4: Coefficient results.
Model | Unstandardized coefficients | Normalized coefficient | Collinearity Statistics | ||||
B | Standard error | Beta | T | Salience | Tolerance | VIF | |
1 (constant) | -262.91 | 338.47 | - | -0.78 | 0.48 | - | - |
X1 | 0.90 | 0.03 | 0.90 | 33.39 | 0.00 | 0.01 | 69.01 |
X2 | 0.00 | 0.01 | 0.01 | 0.20 | 0.85 | 0.01 | 150.47 |
X3 | 0.34 | 0.23 | 0.056 | 1.46 | 0.22 | 0.01 | 134.74 |
X4 | 0.48 | 1.00 | 0.03 | 0.48 | 0.66 | 0.00 | 329.88 |
X5 | 0.41 | 0.29 | 0.10 | 1.42 | 0.23 | 0.00 | 512.55 |
According to Table 4, car production and gross national income are significant, but car ownership, oil consumption, road mileage, and GDP are insignificant. VIF value is more important than ten according to car production, car ownership, oil consumption, etc. There may be a collinear relationship and further verification.
The majority of the independent variables exhibit multicollinearity, which must be addressed. Next, the paper will use stepwise and ridge regression to eliminate multicollinearity between independent variables.
3.2. Stepwise Regression Results
Table 6: Model Data Summary.
Summary of stepwise regression results | |
Method | Stepwise |
Total variables | X1, X2, X3, X4, X5, and X6. |
Reserved variables | X1 |
Discard Variable | X2, X3, X4, X5, and X6. |
Table 7: Results of stepwise regression model.
Linear regression analysis result n=11 | |||||||
Denormalization coefficient | T | p | VIF | R² | Adjust R² | F | |
Constant | -4.241 | -0.419 | 0.685 | - | 1 | 1 | F=34424.642 P=0.000*** |
X1 | 0.999 | 185.539 | 0.000*** | 1 | |||
Dependent variable: automobile sales volume | |||||||
Note: * * *, * * and * represent the significance level of 1%, 5% and 10% respectively.
The original hypothesis that the regression coefficient is 0 is rejected based on the examination of the F test findings, where the significance P value is 0.000 * * *, and the level is significant. The model is well-built and has no multicollinearity issues because the VIF for variable collinearity is less than 10. The model's formula is as follows:
\( Y=-4.241+0.999{X_{1}} \) (2)
This paper aims to retain as many independent variables as possible. The ridge regression method in SPSSPRO is used to correct the results to obtain higher numerical stability and high calculation accuracy. The next is the result of ridge regression, which is used for subsequent analysis.
3.3. Ridge Regression Results
Table 8: Ridge regression analysis result.
K=0.037 | Unstandardized coefficients | T | P | R² | Adjust R² | F |
B | ||||||
Constant | -1458.078 | -5.05 | 0.007*** | 0.995 | 0.987 | 126.263*** |
X1 | 0.497 | 6.476 | 0.003*** | |||
X2 | 0.008 | 0.933 | 0.404 | |||
X3 | 0.897 | 2.158 | 0.097* | |||
X4 | 3.772 | 3.812 | 0.019** | |||
X5 | 0.483 | 2.748 | 0.051* | |||
X6 | -0.296 | -0.815 | 0.461 |
Note: ***, **, * represent the significance levels of 1%, 5%, and 10%, respectively
The parameter K=0.037, the significant P value of the F test is 0.000***, the level is substantial, and the null hypothesis is rejected, indicating a regression relationship between the independent variable and the dependent variable. At the same time, the model's performance is respectably good, with a goodness of fit R2 of 0.995. According to the ridge regression method to eliminate multicollinearity, the model is obtained:
\( Y=-1458.083+0.497{X_{1}}+0.008{X_{2}}+0.897{X_{3}}+3.772{X_{4}}+0.483{X_{5}}-0.296{X_{6}} \) (3)
3.4. Result Analysis
It can be seen that when car sales increase by 10,000 units, car production increases by 0.497 million units, car ownership increases by 0.008 million units, the oil consumption increases by 0.897 million tons of standard coal. And the road mileage increased by 3.772 10,000 kilometers, the GDP grew by 0.483 trillion yuan, and the gross national income decreased by 0.296 billion yuan from the regression equation obtained by SPSSPRO.
According to the revised results of ridge regression, it can be seen that car production has the most significant impact on car sales; oil consumption, road mileage, and GDP also affect car sales, while car ownership and gross national income do not affect car sales. These dependent variables are strongly correlated and influence and interact with each other.
GDP and auto sales are positively correlated. As the GDP has increased, people's living standards have increased, and cities have prospered. Some towns may be desolate, but the city will become lively and thriving when the GDP value reaches a certain height. The higher the per capita GDP, the richer the country and the richer the people, which will promote car sales. However, GNI and car sales tend to be negatively correlated, and the model results contradict assumptions. The gross national income may be critically valued by consulting relevant data and literature. Before the binding deal is reached, people's payments may increase, and they may buy cars. After getting the critical value, people will buy other things or invest their income.
4. Conclusion
The most significant impact on car sales is car production, oil consumption, road mileage, and GDP also affect car sales. At the same time, most of the independent variables have multicollinearity. The insufficiency of this study is that there is no further research on the negative correlation between gross national income and automobile sales. The significance of the article is to find out the factors that affect the sales of automobiles to take specific measures to increase the sales of new energy vehicles. The following are the specific measures.
The government, enterprises, etc., need to expand the production of new energy vehicles. At the same time, they should also increase the construction of industries around new energy vehicles, such as building more charging piles and actively reporting to the people about the production of new energy vehicles and infrastructure in China.
Fuel is used to power fuel-powered vehicles; oil is required mainly for new energy vehicle charging. By analogy, the government should speed up technological breakthroughs in renewable energy power generation and produce more renewable energy power generation facilities, such as large wind turbines and photovoltaic inverters. This will significantly increase the production of electrical energy, thereby indirectly affecting the consumption of electrical energy.
If you want to get rich, build roads first. According to the results, road mileage can promote people’s wealth and car sales. It is suggested that governments at all levels should build more roads. For example, county or township governments should build more tertiary roads to promote village-to-village, township-to-township, and county-to-county connections. This not only improves people's income levels but also promotes cultural exchanges. More importantly, it will encourage the sale of alternative fuel vehicles, lessen pollution, and support the nation's economic development.
At the national level, people should be employed as much as possible, and the employment rate should be reduced. At the same time, it lets people share more labor remuneration and promote consumption. Actively expand overseas projects, such as the "The Belt and Road initiative" peripheral construction, and seek measures to continue to increase GDP from overseas. To indirectly fuel the expansion of the automotive industry and boost sales of new energy vehicles, it is possible to stimulate national economic growth and the development of the financial sector domestically.
These measures will significantly promote people's purchase of new energy vehicles, which will continue to drive the national economy and help protect the environment.