

1. Introduction
Portfolio refers to the combination of different investment assets together in order to diversify risk and maximize returns [1]. With the rapid expansion of China's economy, the role of investment portfolio in the financial field is becoming increasingly important. It is very important for investors to effectively achieve risk diversification, return maximization and stable appreciation.
As the current Chinese market is changing and the market style is evolving, this may pose some challenges to portfolio research. In addition, Shan et al. found out that Chinese stock holds the most diversification benefits but the most policy risk for international investors [2]. Risk control is also of an important issue due to the instability of the Chinese market.
Portfolio theory originated in the 1950s, while in China's stock market, it only began to develop in the 1990s, so the research on the application of portfolio model in the Chinese market are relatively new and still in a blank stage [3-4]. In addition, investors in the Chinese market are generally still in the growth stage, focusing on short-term profits rather than long-term portfolio optimization. In this case, most investors do not use the portfolio model or other tools to optimize the portfolio.
Most of the portfolio models used in China are designed by Western scholars, and more local data and experience are needed before these models are applicable to the Chinese market [5]. One research conducted by Zeng et al. pointed out that Markowitz portfolio theory has a significant application value in China's stock market [6].
As a result, the following is the focus of this paper: Firstly, this paper selects the top five recently active stocks based on the main board active stocks released by the Shanghai Stock Exchange, of which respectively is China United Communications (600050.SH), China Telecom (601728.SH), China Energy Engineering Group (601868.SH), China State Construction Engineering (601668.SH) and Sichuan Changhong Electric (600839.SH). These five stocks have higher investment rate of return and lower investment risk, which helps investors to build a diversified investment portfolio and improve the overall stability and profitability. Secondly, the closing prices of the five stocks from August 1,2022 to December 31,2022 are obtained on Tushare, and the daily returns of each stock are calculated. Then, the correlation matrix and the covariance matrix between the stocks are calculated. Initially equally weighted and market-value-weighted investment portfolio are constructed. To explore the optimal portfolio of stocks, Monte Carlo simulation is used to perform the analysis: a set of weights are generated at random, the return and standard deviation under this combination are calculated. The return and standard deviation of each combination are plotted into a scatter plot after this process is run 10,000 times. To determine the weights of these five stocks, the scatter plot is used to identify the combinations with the lowest risk and highest Sharpe ratio. Finally, the cumulative returns of the four combinations are calculated and drawn into a line graph to get the optimal portfolio.
2. Data
The data of this paper comes from Tushare. Five chosen company are China United Communications, China Telecom, China Energy Engineering Group, China State Construction Engineering and Sichuan Changhong Electric. The stock codes are 600050.SH, 601728.SH, 601868.SH, 601668.SH and 600839.SH. These five stocks are top five active stocks on the Main Board according to Shanghai Stock Exchange. The reason why selected these five stocks is that active stocks have large trading volume and low volatility and uncertainty in a short period of time [7]. Choosing active stocks can help investors obtain higher investment returns, and help investors grasp the pulse of the market and learn more information about industry trends, so as to better manage risks and take advantage of market opportunities.
Closing prices from August 1st, 2022, to December 30th, 2022, of each stock are chosen for further processing. After calling up data for this period on Tushare, 104 pieces of stock data were obtained. In this paper, linear returns were calculated for these closing data and 103 pieces data were obtained. This paper divides these data into two groups. The previous 71 pieces of data from August 1st, 2022, to November 15th, 2022, were selected and used to calculate the weights. The real returns of the rest of data from November 16th, 2022, to December 30th, 2022, were calculated based on the weights of first group. Descriptive statistics of prices of these selected data can be shown as follows in Table 1 and Table 2.
Table 1: Descriptive statistics of prices of selected assets.
600050.SH | 601728.SH | 601868.SH | 601668.SH | 600839.SH | |
count | 104 | 104 | 104 | 104 | 104 |
mean | 3.8062 | 3.9535 | 2.3294 | 5.2211 | 2.7375 |
std | 0.5515 | 0.2232 | 0.0893 | 0.3162 | 0.0838 |
min | 3.3100 | 3.6800 | 2.2100 | 4.7400 | 2.5900 |
25% | 3.4300 | 3.7700 | 2.2600 | 4.9725 | 2.6600 |
50% | 3.5500 | 3.9000 | 2.3100 | 5.1550 | 2.7500 |
75% | 4.0950 | 4.0550 | 2.3800 | 5.3950 | 2.7900 |
max | 5.2000 | 4.5900 | 2.6000 | 6.1100 | 2.9700 |
Table 2: Descriptive statistics of daily returns.
600050.SH | 601728.SH | 601868.SH | 601668.SH | 600839.SH | |
count | 103 | 103 | 103 | 103 | 103 |
mean | 0.0030 | 0.0013 | 0.0002 | 0.0010 | -0.0011 |
std | 0.0275 | 0.0128 | 0.0197 | 0.0190 | 0.0120 |
min | -0.0579 | -0.0347 | -0.0423 | -0.0410 | -0.0505 |
25% | -0.0101 | -0.0052 | -0.0105 | -0.0109 | -0.0072 |
50% | 0.0000 | 0.0000 | -0.0042 | -0.0018 | 0.0000 |
75% | 0.0090 | 0.0053 | 0.0087 | 0.0118 | 0.0072 |
max | 0.0997 | 0.0576 | 0.1017 | 0.0757 | 0.0232 |
As is illustrated in the table, in terms of the mean returns of these data, the highest is 600050.SH and the lowest is 600839.SH. As for the variance if these data, 600050.SH is the highest and 600839.SH is the lowest. Additionally, the max return appears at 601868.SH and the min return appears at 600050.SH.
3. Method
3.1. Markowitz Model and Monte Carlo Simulation
The problem of portfolio selection was solved in Harry Markowitz's 1952 work Portfolio Selection using probability theory and the secondary planning approach, which is a precursor to modern portfolio management theory [8]. The Markowitz portfolio theory contains the mean-variance model and the efficiency boundary theory, which are predicated on the notion that investors are risk-averse and aim to maximize their expected returns. According to this theory, the portfolio's expected return and investment risk are measured, respectively, using the mean and variance.
Finding the portfolio with the lowest risk at the same return level or the portfolio with the best return at the same return level is the objective of the investment decision. These two requirements are met by the portfolio on the effective boundary.
Using the expected returns and variation of stocks, Markowitz contends in this work that a "effective boundary" can be identified under a specific premise. This "effective boundary" indicates both the portfolio with the highest return rate under the same risk as well as the portfolio with the least risk with a given projected return [8].
Monte Carlo simulation is a method for statistical analysis by random sampling. It is commonly used for complex, computationally intractable problems, where stochastic events are a key factor [8]. The basic idea of Monte Carlo simulation is to generate a large number of results through random sampling, and then use them to estimate various statistical indicators, such as probability, mean, variance, and so on. In practice, Monte Carlo simulation is widely used in finance, physics, statistics and other fields, and has high accuracy and reliability.
3.2. Minimum Volatility Portfolio
The global minimum volatility portfolio, or GMV portfolio, is the portfolio with the lowest standard deviation (risk) and the highest return for the given risk level, which is suitable for risk-averse investors [9].
GMV portfolio can be constructed in many ways, among which the Markowitz model and the covariance method are more commonly used. The Markowitz model realizes the asset allocation by calculating the correlation and yield rate between different assets, and then determining the weight of the portfolio according to the individual's risk preference and expected rate of return.
The covariance method is to calculate the covariance matrix between each asset, find the interrelationship between each asset, and use this as a basis to build the portfolio.
The advantage of the GMV portfolio is that it can effectively reduce the risk of the portfolio and improve the return. At the same time, it can diversify the asset allocation and diversify the investment risk into different asset classes, effectively avoiding the risk of a single asset.
3.3. Maximum Sharpe ratio
The Sharpe Ratio was proposed in 1966 by Nobel Prize winner William Sharp as a risk adjustment index to measure the fund performance. Rational investors generally fix the tolerable risk and pursue the maximum return or pursue the minimum risk in the fixed expected return. It is the ratio of the excessive expected return of the portfolio to the overall standard deviation. The calculation formula is as follows:
\( Sharpe Ratio=\frac{{R_{p}}-{R_{f}}}{{σ_{p}}} \) | (1) |
Where \( {R_{p}} \) is the desired percentage return. \( {R_{f}} \) is risk-free rate of interest. \( {σ_{p}} \) is the standard deviation of the excess return [10]. By dividing the mean of the excess return by its standard deviation, we can get the Sharpe ratio of return and risk. Also, multiple the sqrt (252) (252 trading days per year) to get an annualized Sharpe ratio.
Sharpe ratio calculates the excess return per unit of risk, and in order to make a better decision, we need to find a balance between return and risk, namely the optimal Sharpe ratio.
4. Result
4.1. Correlation Matrix and Covariance Matrix
Based on the previously calculated returns of each stock, the correlation matrix between each stock is obtained, as shown in Table 3. Heat map is constructed to visualize the result, as shown in Figure 1.
Table 3: Correlation matrix of returns among each stock.
600050.SH | 601728.SH | 601868.SH | 601668.SH | 600839.SH | |
600050.SH | 1.0000 | 0.7302 | 0.3336 | 0.4369 | 0.2973 |
601728.SH | 0.7302 | 1.0000 | 0.3951 | 0.5316 | 0.3452 |
601868.SH | 0.3336 | 0.3951 | 1.0000 | 0.5607 | 0.4108 |
601668.SH | 0.4369 | 0.5316 | 0.5607 | 1.0000 | 0.4545 |
600839.SH | 0.2973 | 0.3452 | 0.4108 | 0.4545 | 1.0000 |
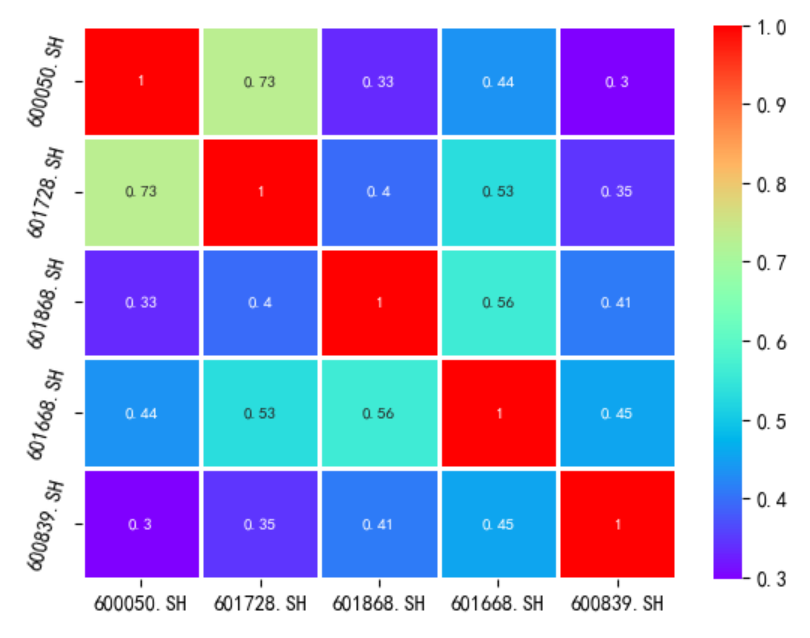
Figure 1: Heat map of correlation matrix.
The correlation coefficient only reflects the linear relationship between the stocks, and does not indicate the volatility of the stock, while the covariance matrix can reflect this information.
The annualized return of each stock is recalculated to obtain the covariance matrix, as shown in Table 4.
Table 4: Covariance matrix of annualized returns among each stock.
600050.SH | 601728.SH | 601868.SH | 601668.SH | 600839.SH | |
600050.SH | 0.1907 | 0.0649 | 0.0456 | 0.0576 | 0.0247 |
601728.SH | 0.0649 | 0.0415 | 0.0252 | 0.0327 | 0.0134 |
601868.SH | 0.0456 | 0.0252 | 0.0977 | 0.0530 | 0.0245 |
601668.SH | 0.0576 | 0.0327 | 0.0530 | 0.0913 | 0.0262 |
600839.SH | 0.0247 | 0.0134 | 0.0245 | 0.0262 | 0.0363 |
According to Table 3, Fig. 1 and Table 4, the correlation coefficient and covariance between each stock are small and suitable for constructing portfolio. In total, four types of portfolios are constructed in this paper according to different weights allocation. Before constructing Markowitz model, two simpler portfolios are constructed and compared.
4.2. Equally Weighted and Market-value-weighted Portfolio
The first portfolio model applied in this paper is equally weighted portfolio. Allocate equal weight to each stock, namely 0.2. This is the simplest investment method and can be used as a reference benchmark for other portfolios.
The second portfolio is market-value-weighted portfolio. Daily market values from August 1,2022 to December 31,2022 of each stock are extracted from Wind Stock Database. Calculate the average market value and allocate weights to each stock. In this paper, the market-value weight for each stock is 0.15,0.44,0.11,0.28 and 0.02.
Stock returns of two portfolios are calculated and cumulative return curve are drawn, as shown in Figure 2.
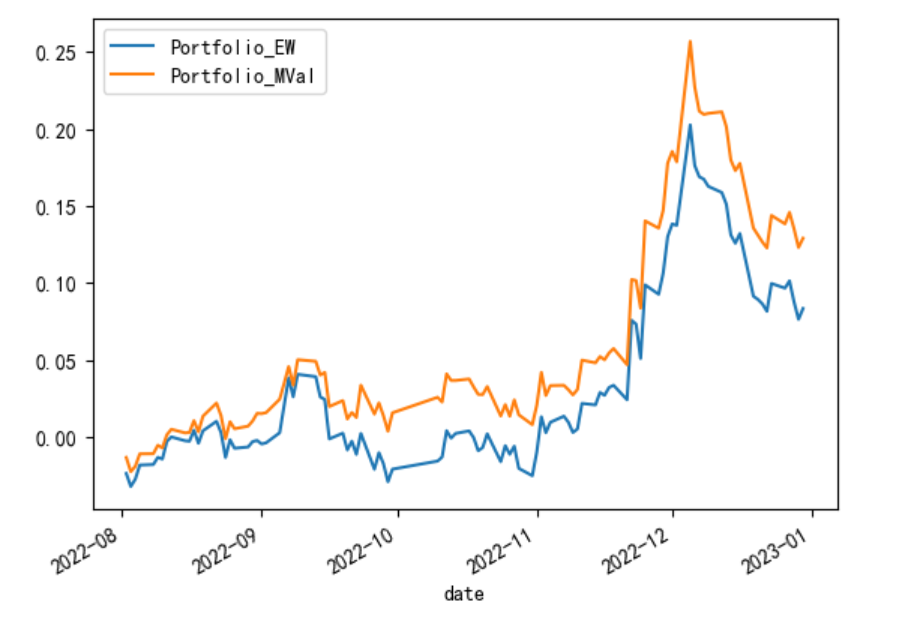
Figure 2: Cumulative return curve of the two portfolios.
According to Figure 2, the market-value-weighted portfolio is slightly better than equally weighted one.
4.3. Optimal Portfolio Selection
Monte Carlo simulation is used to conduct the analysis, that is, a set of weights is randomly generated, calculating the returns and standard deviation under the combination, repeating the process many times (such as 10,000 times), and drawing the returns and standard deviation of each combination into a scatter plot, as shown in Figure 3.
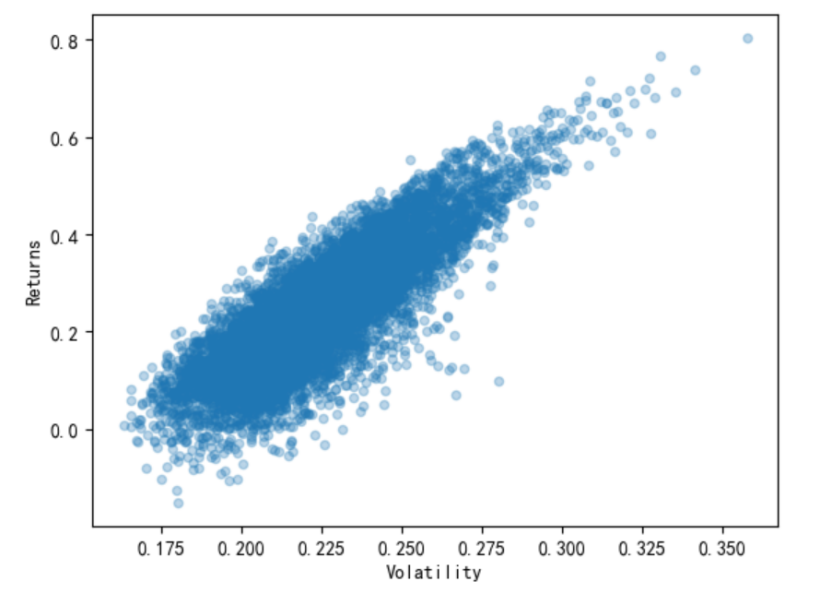
Figure 3: Scatter plot.
The scatter plot above illustrates risk and return, which are the two main components of investment. The ordinate is the rate of return, the abscissa is the standard deviation of risk, and each point represents the state of a portfolio. Markowitz Portfolio theory holds that rational investors always maximize the expected return at a given risk level or minimize the expected risk at a given return level. Only the points on the effective boundary are the most effective portfolio. Combinations with minimal risk are found and plotted in scatter plots representing return-risk, as is shown as the red point in Figure 4.
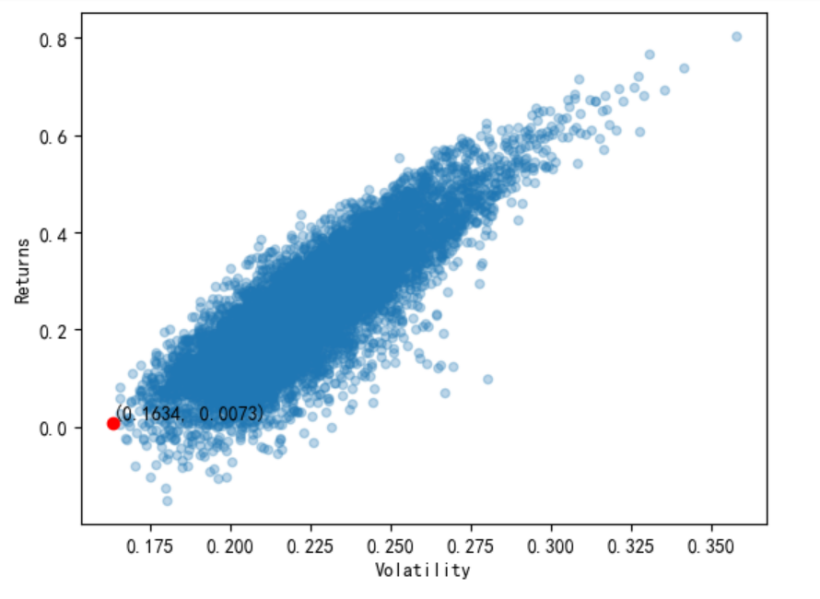
Figure 4: Combinations with minimal risk.
The weights of the minimum risk portfolio is as follows in Table 5.
Table 5: Weights of GMV portfolio.
600050.SH | 601728.SH | 601868.SH | 601668.SH | 600839.SH | |
weights | 0.0128 | 0.4202 | 0.0079 | 0.0280 | 0.5311 |
Combinations with maximum Sharpe ratio are found and plotted in scatter plots representing return-risk, as is shown as the red point in Figure 5.
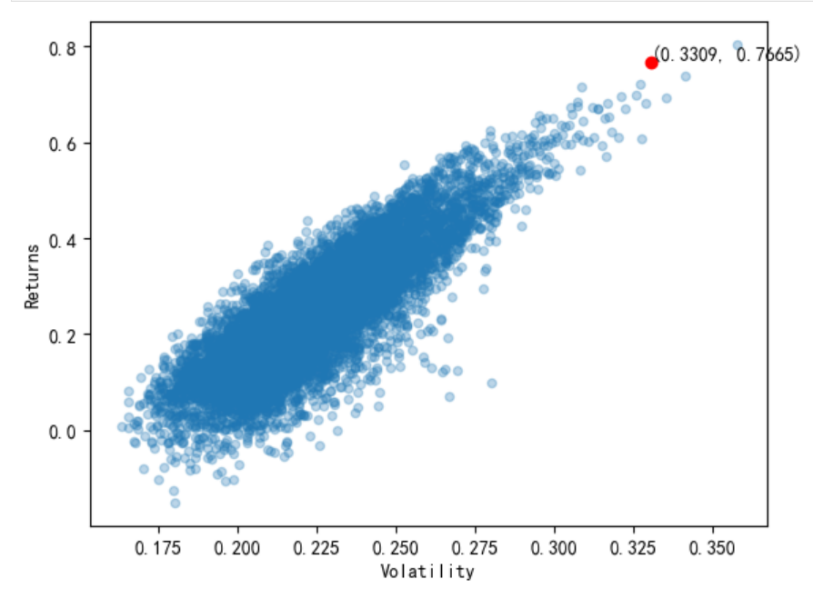
Figure 5: Combinations with maximal Sharpe ratio.
The weights of the minimum risk portfolio is as follows in Table 6.
Table 6: Weights of GMV portfolio.
600050.SH | 601728.SH | 601868.SH | 601668.SH | 600839.SH | |
weights | 0.6349 | 0.1993 | 0.0318 | 0.1139 | 0.0201 |
Apply the weights obtained from the four portfolios to calculate the cumulative returns during the test period, and the overall curve graph can be seen in Figure 6.
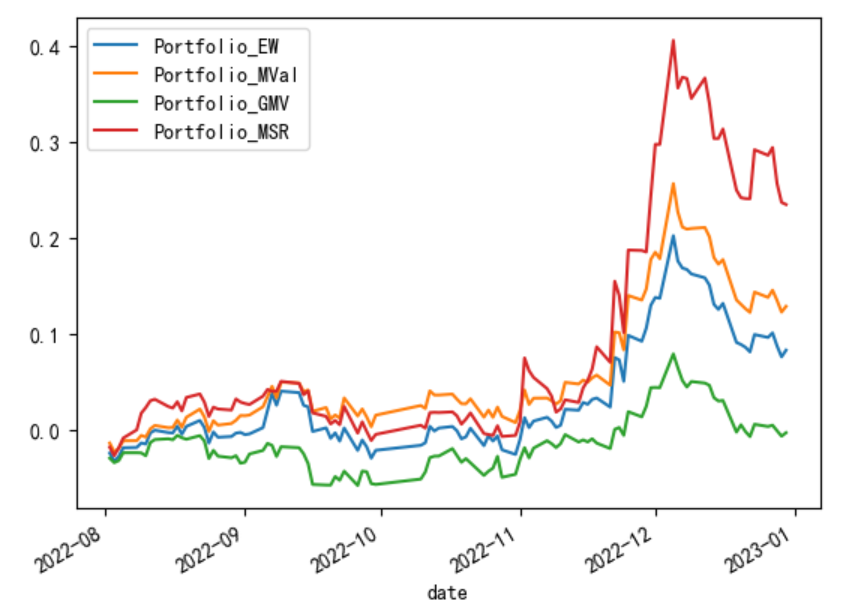
Figure 6: Cumulative return curve of four portfolios.
According to Figure 6, the maximum Sharpe ratio portfolio is the best combination compared to other portfolios.
5. Conclusion
Since the portfolio theories have been introduced into China very recently, the relevant data and practical application are limited. Based on this, this paper applies four portfolios for the selected five main board active stocks and selects the best portfolio, giving investors enlightenment on portfolio allocation. In this paper, Monte Carlo simulation is utilized to simulate 10,000 combinations of portfolio. Then, the minimal risk and maximal Sharpe ratio portfolio are obtained by mean-variance method. Four set of weights are collected and each cumulative returns are calculated to find out results. From the overall curve of four portfolios, the maximal Sharpe ratio portfolio is the best portfolio in this paper.
However, the optimal portfolio we chose in the end is trivially better than the others, which indicates there’s more better portfolios not included in this paper. The data used in this paper only includes a certain period of time. Considering the risk and return pf stock market is changing and the ranks of active stocks on main board is changing too, the absolute level of return cannot be determined by a certain period of time. However, this still does not object the idea that if two aspects of return and risk are comprehensively considered, the combination of stocks is better than the underlying stocks. Due to the limitations of the theory itself, investors should not blindly apply the theory to guide their investment decisions. Therefore, dynamic ideology and real-life situation should be considered in further research on portfolio allocation.