


1. Introduction
Loans form the foundation of banking operations, serving as a key driver of income generation and economic growth. Banks generate substantial interest revenue by leveraging the spread between deposit and loan interest rates, which constitutes a major share of their earnings [1]. Among various loan types, Personal loans, which accounted for 10%-20% of non-revolving credit in the U.S. by 2022 [2], stand out due to their higher risk, as they are largely unsecured and lack standardised methods for assessing a consumer’s repayment ability [3].
The loan allocation strategy operates from both the demand and supply sides. From a demand-side perspective, banks collect and analyse private financial data to assess borrower creditworthiness in the loan application process, ensuring that funds are allocated to individuals and businesses with strong repayment capacity. Over the past decade, technological advancements—particularly machine learning and predictive algorithms—have revolutionised the decision-making process in banking, offering sophisticated tools to optimise loan allocation instead of only relying on professional staff. To avoid the risk of non-performing loans (NPLs) and enhance effectiveness, different machine learning methods have been applied to this field and have achieved excellent performances by improving the prediction accuracy and saving costs for the bank [4]. However, existing studies have mainly focused on credit risk assessment and loan default prediction, neglecting supply-side factors in the lending decision-making process.
On the supply side, banks offer tailored loans to eligible consumers proactively, shifting from passive approval to actively seeking, which aims to convert liability-holding individuals, commonly referred to as “debt consumers”, into active personal loan clients, thereby enhancing profitability and market penetration [5].In the traditional process, fundamental demographic features such as income and credit scores are regarded as indicators, normally achieving an average conversion rate of just 4% [2]. However, this traditional segmentation method may lead to missing substantial potential consumers and substantial marketing costs for sending specific offers to non-target groups due to the low sensitivity and accuracy of the indicators.
To address this gap by improving the effectiveness of identifying the most appropriate consumers for a specific loan offer, this study employs four machine learning algorithms, relying on their abilities to build complicated patterns on vast amounts of features and strong predictive power, and evaluates their performance to determine the best models. These four algorithms are decision trees, random forest, logistic regression, and KNN. Model performance is assessed using classification metrics such as accuracy, precision, recall, and F1-score. These four selected models represent a balance between interpretability, simplicity, and predictive power. Four models will be applied separately to the same dataset, publicly available on Kaggle [6]. Beyond methodological contribution, the findings aim to assist banks in enhancing supply-side targeting strategies, thereby improving consumer engagement and boosting market penetration. Therefore, this study simulates a real-world scenario involving a US-based bank, hereafter referred to as Neo Bank, which seeks to improve the effectiveness of its pre-approved personal loan offers, and the dataset obtained from Kaggle mirrors the profiles of Neo Bank’s consumers.
The rest of the essay is divided into the following sections: Section 2 provides a brief literature review of machine learning methods in the loan lending process, focusing on the four models used in this study. Sections 3 and 4 introduce the methodology, including a description of the dataset, data processing and the model architectures of the four algorithms used in this study: decision tree, K-nearest neighbours (KNN), random forest, and logistic regression. Section 5 presents the results of the model after training and testing, followed by a discussion of key findings and their implications. Finally, Section 6 concludes the paper by offering business insights and practical recommendations, particularly tailored for neo banks seeking to enhance their loan marketing strategies through predictive analytics.
2. Literature review
This section briefly reviews some existing studies on the applications of machine learning methods in the loan lending process, with a particular emphasis on the four algorithms used in the paper. These techniques have transformed the traditional decision-making process and enhanced the efficiency of loan approval and acceptance predictions.
As one of the most widely applied decision-making techniques in finance, the decision tree has an interpretable and understandable structure. It splits input data based on various features in the form of branches, leading to categorical outputs shown in the leaves of the tree [7]. In contrast to other models that exploit numeric weights to represent relations among nodes, decision trees use logical rules, hence are very interpretable [7]. Its accuracy varies across studies and datasets. According to Karthik and David [8], the decision tree performed poorly compared to Naive Bayes in classifying loan approval, reaching just 69% accuracy in a sample of 618 applicants. Contrarily, upon using a larger dataset to train the model, the research conducted by Wang and Duan [9] illustrates how decision tree algorithms have enhanced the efficiency, along with the correctness, of assessing risk before loan approval by attaining 81.2% accuracy. This variance implies that the accuracy might be site-sensitive. While in the prediction of loan acceptances, much less research has been done using decision trees. This area is an area that is open for future investigation in the utilisation of decision tree algorithms to evaluate the process of loan acceptance. A derivative of decision trees, the random forest, which is based on ensembles, alleviates overfitting while increasing the generalisability [10], in contrast to decision trees. It has also been shown to have good predictive accuracy in loan approval exercises. A comparison study carried out by Madaan et al [11]. indicates that the random forest performs better compared to decision trees in a large dataset of loan data. Similar to decision trees, the utilisation of random forests to predict loan acceptances remains less investigated in the literature.
In contrast to the intricate models presented above, logistic regression is a commonly utilized algorithm for simulating binary responses, particularly in observational studies, with greater transparency [12]. Azeez and Emmanuel [4] once compared eight models for loan approval prediction and concluded that the most reliable model was the logistic regression model due to the model's high sensitivity. Logistical regression also demonstrates impressive competence with a 90.2% accuracy in the loan acceptance prediction [13]. Similarly, K-Nearest Neighbours (KNN), another straightforward but efficient algorithm, achieves an accuracy of up to 75% in loan approval forecast [14]. Despite some investigators expressing doubts about whether or not the algorithm is suitable, due to data sensitivity to scale and computational inefficiency [4], the aim of this study is to investigate the potential of KNN in loan acceptance prediction due to the algorithm's ease of implementation, adaptability, and parsimony. As this study focused on four widely utilized algorithms—decision tree, K-nearest neighbors (KNN), random forest, and logistic regression—future research has established the potential of other machine learning models, including Support Vector Machines (SVM), XGBoost, CatBoost, and multilayer perceptrons (MLP), for the prediction of loan acceptance outcomes [13]. Despite the increasing attention, most studies that exist are mainly focused on loan approval or credit risk analysis, with relatively fewer studies being paid to the area of loan acceptance. This study aims to address this gap through the evaluation of the effectiveness of algorithms chosen to forecast customer responses to pre-approved personal loan terms and offers insight for future bank growth."
3. Data insight
3.1. Data description
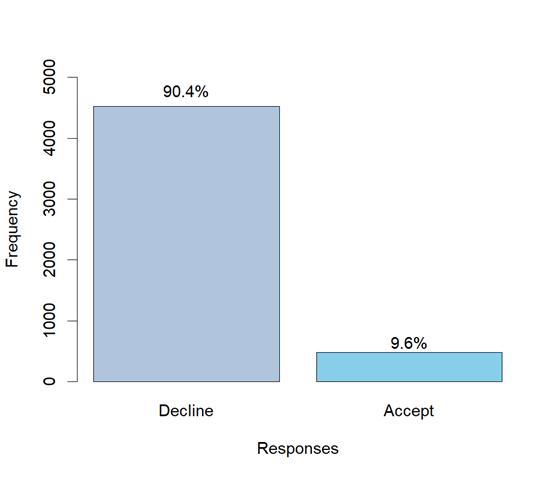
As outlined in the introduction, the dataset used in this study was obtained from Neo Bank, a U.S.-based retail bank with a growing customer base. While the bank maintains a substantial number of depositors (liability customers), only a small proportion have previously taken out personal loans. In a personal loan campaign conducted last year, the conversion rate was 9.6%, which motivates this study's objective to build a predictive model for identifying potential loan acceptors [6].
The raw dataset contains 5,000 customer records with 14 features, covering fundamental demographic variables such as age, family and income, variables showing different financial products customers currently hold with the bank, such as mortgage and securities account and responses consumers made towards the last loan campaign. Table 1 provides more detailed information about the 14 variables, including each column's mean and standard deviation.
|
The dataset studied in this project consists of 5000 observations of the following 14 variables |
|||||
|
Variables |
Description |
Unit |
Range |
Average |
standard deviation |
|
ID |
Customer's Unique Identity |
None |
1~5000 |
2500 |
1443.52 |
|
Age |
Customer's age in the completed year |
Years |
23~67 |
45.34 |
11.46 |
|
Experience |
Years of professional experience |
Years |
-3~43 |
20.1 |
11.47 |
|
Income |
Annual income of the customer |
Thousand dollars |
8~224 |
73.77 |
46.03 |
|
ZIPCode |
Home address ZIP code |
None |
90005~ 96651 |
93169 |
1759.46 |
|
CCAvg |
The family size of the customer |
Number of people |
0~10 |
1.938 |
1.75 |
|
Family |
Average spending on credit cards per month |
Thousand dollars |
1~4 |
2.396 |
1.15 |
|
Education |
Educational Level 1:Undergrad; 2:Graduate; 3:Advanced/Professional |
None |
1~3 |
1.881 |
0.84 |
|
Mortgage |
Value of house mortgage |
Thousand dollars |
0~635 |
56.5 |
101.71 |
|
Personal loan |
0: Decline the personal loan offer in the last campaign; 1: Accept |
None |
0/1 |
0.096 |
0.29 |
|
Securities Account |
0:No securities account with the bank; 1:Do have securities account |
None |
0/1 |
0.1 |
0.31 |
|
CD_Account |
0: No certificate of deposit(CD) account with the bank; 1: Do have |
None |
0/1 |
0.06 |
0.24 |
|
Online |
0: Do not use internet banking facilities; 1: Use Internet banking facilities |
None |
0/1 |
0.6 |
0.49 |
|
Credit CARD |
0: No credit card issued by any other bank; 1: Do have credit cards with other bank |
None |
0/1 |
0.29 |
0.46 |
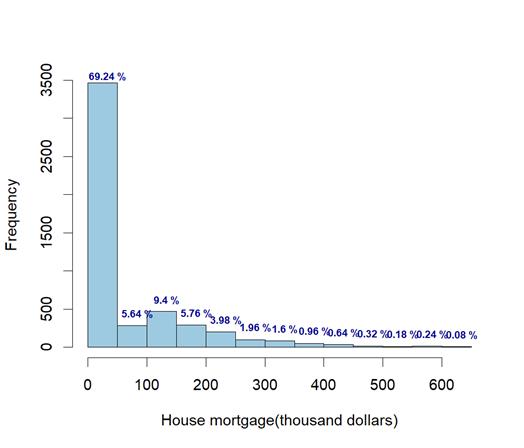
This dataset spans a wide age range from 23 to 67, with 20.1 years of experience on average, which implies the customers' considerable career background. Notably, the house mortgage variable exhibits an exceptionally high standard deviation compared to other variables. The distribution of mortgages shown in Figure 1 demonstrates the various demands of consumers for loans. Furthermore, only 9.6% of the consumers accepted the loan from the last campaign, which serves as the core variable in the model to test. The dataset’s high imbalance ratio of 9.41 suggests a significant imbalance between the classes (loan acceptance vs. non-acceptance). This imbalance poses a potential risk of overfitting and bias, which will be addressed in the model-building and evaluation phases.
3.2. Data processing
According to Table 1, the experience variable contains a minimum value of -3, which is not a logically valid input. Therefore, all negative values in the experience column are regarded as input errors and replaced with their absolute values. Categorical encoding was applied to convert non-numeric variables into machine-readable formats to prepare the dataset for machine-learning models. The encoding methods were selected based on the nature of each variable. As shown in Table 1, ordinal variables such as Education Level were encoded to preserve their inherent order. For binary variables such as personal loan acceptance and securities accounts, zero was mapped with No and one was mapped with Yes.
To eliminate redundancy and improve model performance, irrelevant features such as the customer ID were removed from the dataset. The ZIP Code variable, which originally contained high-cardinality values, was simplified by extracting its first two digits. This transformation reduced the uniqueness of each ZIP code and grouped customers into seven broader geographic categories, enhancing generalizability without losing location context.
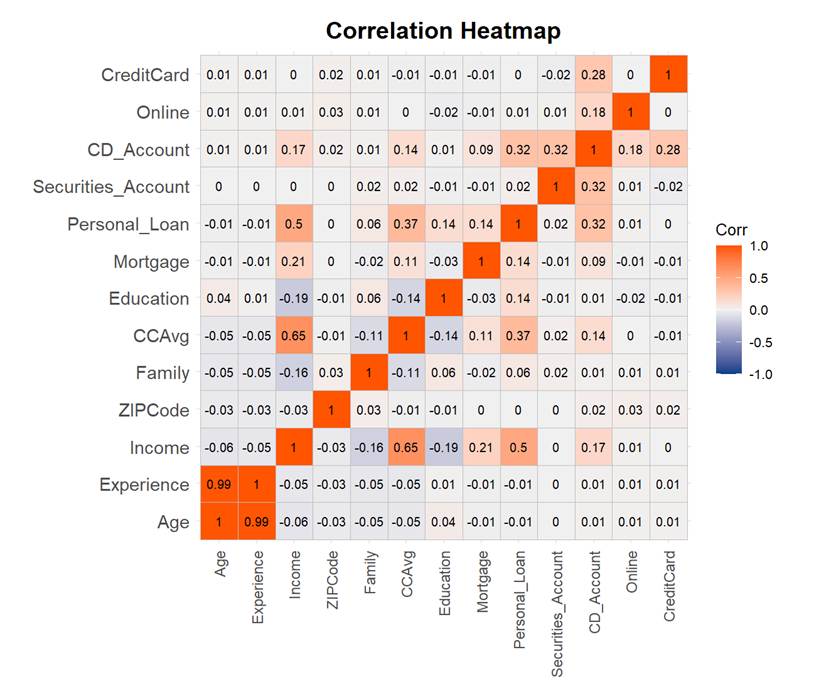
A correlation heatmap (Figure 3) was used to identify influential features. Variables such as income (r=0.5) and CCAvg (credit card average spending)(r=0.37) showed relatively strong positive correlations with the target variable (Personal loan), indicating their likely influence on loan acceptance. Additionally, most features exhibited moderate associations with the response to the previous loan campaign, supporting their inclusion in the predictive model. For the model building, the dataset was divided into training and test groups at a ratio of 70%/30%.
4. Methodology
4.1. Decision tree model
A decision tree (DT) is a supervised learning model based on a hierarchical tree structure, designed to perform classification or regI am running a few minutes late; my previous meeting is running over.ssion tasks by recursively partitioning the feature space. Given a training dataset
Impurity metrics, such as the Gini coefficient or information gain, are used for classification tasks. For regression tasks, variance reduction is applied. Node splitting is applied recursively to each child node until a stopping condition is met. Examples of stopping conditions include the number of samples in the node being below a threshold (n_(min)) or all samples sharing the same label. Unsplit nodes become leaf nodes, and the predicted value of a leaf node is determined by the majority class (for classification tasks) or the mean (for regression tasks) of the samples in the node. Information gain (IG) measures the reduction in entropy after splitting. For a given feature a, IG is calculated using the following formula:
where
The Gini Index quantifies the impurity of a dataset as:
So, the optimal split maximizes the Gini impurity reduction:
4.1.1. Pre-pruning and post-pruning of decision trees
Pre-pruning prevents overfitting by halting tree growth during the construction phase using heuristic stopping criteria. These criteria include a minimum sample split threshold, where splitting stops if the number of samples at a node
where
4.2. Logistic regression
Logistic regression is widely used for binary classification tasks. It has three main advantages: simplicity, interpretability, and efficiency. Additionally, it is advantageous to use logic regression when analyzing large data sets because it reduces the risk of over-fitting. In our research, we constructed a set of logic functions using logic regression models to allocate cases to their most probable category. These logic functions can be used to predict the probability of a specific output.
The probability in the logistic regression model is calculated as follows:
Gradient descent or other optimization algorithms are used to find the optimal parameters.
4.3. k-Nearest Neighbors (kNN)
KNN (k-Nearest Neighbor) is a straightforward yet effective non-parametric algorithm that is primarily employed in classification and regression tasks. A notable advantage of KNN is its simplicity and ease of implementation. KNN is highly versatile and does not make any assumptions about the underlying data distribution. This property renders it particularly effective in complex data sets that are non-linear and heterogenous. To illustrate, consider the training dataset
In the context of the classification task, the selection of the input tags is determined by the majority vote of the k nearest neighbors. The selection of k and the distance measurement can significantly impact the performance of the algorithm. To mitigate the occurrence of over- or under-fitting, we propose a cross-validation approach to identify the optimal value of k.
4.4. Random forest
The random forest algorithm is a machine learning method that integrates multiple decision trees to enhance performance, reduce overfitting, and improve the robustness of the model. The algorithm's key features are its flexibility, accuracy, and management of high-dimensional data sets. Additionally, the random forest algorithm provides a measure of the importance of features, which is useful for understanding the most significant features in subsequent studies.
The utilization of a random forest algorithm with a training dataset
In the formula,
5. Result and discussion
This paper employs decision tree, KNN, logistic regression and random forest to fit the data. Four evaluation indexes are used to check the model performance, including accuracy, recall, precision and F1 score.
|
Model |
Accuracy |
Recall |
Precision |
F1-Score |
|
Pre-pruning DT |
0.9860 |
0.9329 |
0.9267 |
0.9298 |
|
Post-pruning DT |
0.9633 |
0.8926 |
0.7733 |
0.8287 |
|
Random Forest |
0.9813 |
0.8255 |
0.9840 |
0.8978 |
|
KNN |
0.9033 |
0.3423 |
0.5204 |
0.4130 |
|
Logistic Regression |
0.9067 |
0.3960 |
0.5413 |
0.4574 |
Regarding accuracy, pre-pruning DT has the highest score(0.9860), and KNN gets the lowest at 0.9067. As the four models all achieve an accuracy exceeding 0.90, this suggests that these four models demonstrate strong performance in identifying the proportion of correctly predicted samples (both positives and negatives) out of all samples. Compared to other models shown in Table 3, not only do the models evaluated in this study perform well, but the majority of models show consistently high accuracy based on the same dataset, underscoring the effectiveness of classification techniques in this context. However, considering the high imbalance ratio of the dataset, it is not reliable to only use accuracy in evaluation. Unlike the paper conducted by Huang Wang and Wu [13], this paper also use Recall rate, precision and F1-Score to evaluate the four models more comprehensively. According to Table 2, both KNN and Logistic Regression performed significantly worse than the other models across the remaining three evaluation metrics, further supporting the notion that the high class imbalance considerably affects model assessment. In order to find the model with the best performance, emphasis is placed on the rest of three models.
|
Author |
Model |
Accuracy |
|
Akca and Sevil [15] |
Poly SVC |
0.972 |
|
Huang Wang and Wu [13] |
SVM |
0.9744 |
|
Huang Wang and Wu [13] |
Xgboost |
0.9852 |
|
Huang Wang and Wu [13] |
Catboost |
0.9858 |
|
Huang Wang and Wu [13] |
MLP |
0.9744 |
|
Huang Wang and Wu [13] |
Logistic Regression |
0.8885 |
Regarding the remaining three metrics, the pre-pruning decision tree exhibits robust and well-balanced performance, with all scores surpassing 0.90. By contrast, post-pruning decision forest and random forest highlight their advantages in alternative areas. Recall rate is a primary concern to banks, because the lost loan interest income from missing a potential customer far outweighs the wasted resources of misjudging a non-potential customer. In terms of recall, the post-pruning decision tree shows a higher score at 0.8926 compared with 0.8255 obtained by the random forest, while both models fall short of the pre-pruning decision tree(0.9329). However, with respect to precision, which reflects the ability to correctly identify the true loan accepters among predicted positives and reduce marketing cost, random forest shows its great strength, by achieving the highest score at 0.9840. From the perspective of the business impact trade-off between false positives and false negatives, the choices of the model also depend on the differences in the costs of different prediction errors in the actual banking business. The high precision score of the random forest shows its great advantages in reducing the false positive rates, which makes it more suitable for the “precise identification” step and avoids wasting marketing resources, while the high recall score of the decision tree shows its great power in lowering the false negative rates, which makes it more suitable to the “potential customer exploring” step for preliminary customer screening and marketing list generation.
As for the F1 score, which serves as a harmonic mean that balances both recall and precision, the pre-pruning decision tree undoubtedly performs the best because of its holistic ability, while the random forest performs slightly better than the post-pruning decision tree.
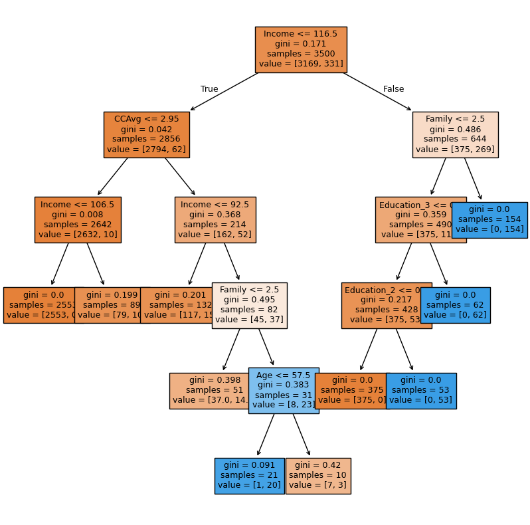
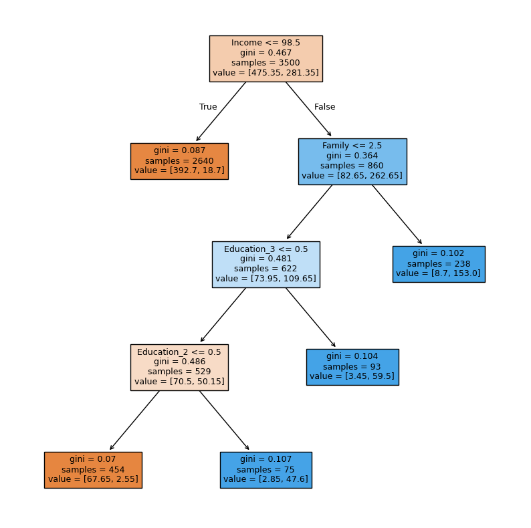
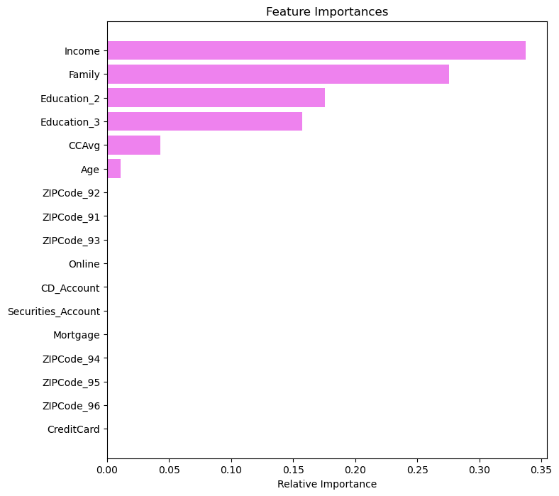
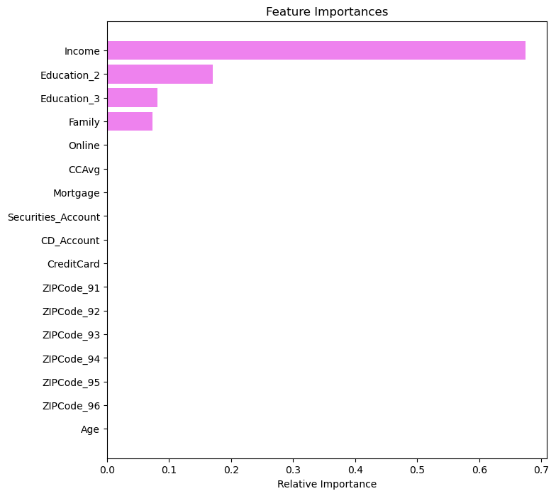
Therefore, across all four metrics, the pre-pruning decision tree delivers consistent and superior performance on this dataset. On the one hand, these results highlight the great potential of tree-based machine learning methods in predicting loan acceptance behaviour in the banking sector. On the other hand, developing a hybrid approach that integrates multiple algorithms may serve as a promising direction for future work, as the current models exhibit complementary strengths across different evaluation metrics. Another surprising finding in the results is that the pre-pruning decision tree outperforms the post-pruning decision tree on this dataset. There might be three reasons. Firstly, the decrease in precision may result from a trade-off aimed at improving the generalizability. Secondly, the high imbalance ratio may influence the models’ performance. A pre-pruning decision tree might have a higher score due to the extreme class imbalance. Figure 4 suggests that some leaf nodes achieve pure minority-class with gini at 0, which may result in a high recall rate while posing a risk of overfitting, as these nodes contain limited samples. However, in the pruned decision tree, perfectly pure paths have been eliminated(Figure 5), demonstrating more conservative performance and likely higher robustness. Thirdly, by comparing the feature importance figures (Figures 6&7), CCAvg and age have been removed from the pruned decision tree, while they play a vital role in the pre-pruning decision tree. It shows a potential risk that the pruned tree will perform worse because of the discarding of possibly useful decision information specific to minority samples.
In addition to the performance in 4 indicators such as precision and recall, the interpretability of the model and the feasibility of actual deployment are also important reference parts. From the perspective of interpretability, the pre-pruned decision tree performs the best. The clear structure and organized logic of the pre-pruned decision tree shown in Figure 4 displays the criteria of each type of classification, making it easier for bank workers to understand how to make judgments based on factors such as income, education level, and family size. It is particularly suitable for financial business processes that require model auditing or manual review, such as credit approval and risk assessment. At the same time, the high F1 score and high Recall also ensure that predictive ability is taken into account while maintaining interpretability. Therefore, a relatively ideal balance is achieved between interpretability and performance. The post-pruned decision tree further simplifies the model structure, weakens the risk of overfitting, and improves the generalization ability of new samples. But its F1 and Recall are inferior to the pre-pruned model. The post-pruned decision tree is more suitable for use in conditions with frequent data fluctuations. To sum up, although tree-based algorithms show excellent performance on this dataset, the performance of pre-pruning decision trees and post-pruning decision trees needs validation on different and more balanced datasets.
The limitation of the data includes several problems. Firstly, the dataset used primarily consists of historical financial and demographic data, which does not account for real-time financial behaviors. Therefore, this limitation will reduce the model’s adaptability to dynamic financial conditions. Also, the model relies heavily on structured financial data but does not incorporate behavioral or psychological factors, such as risk aversion, spending habits, or social influences, which can also impact loan acceptance decisions. While machine learning enhances predictive accuracy, biases may emerge due to imbalances in the dataset. The model might underrepresent these groups, leading to potentially unfair loan marketing decisions.
6. Conclusion and recommendation
This study compared four machine learning models to predict whether customers would accept Neo Bank's personal loan offer and to identify key customer characteristics influencing loan acceptance rates. The four machine learning models were decision tree, random forest, K-nearest neighbor and logistic regression model. Among them, the decision tree model had been optimized through pre-pruning and post-pruning. The results showed that the accuracy rate of the pre-pruning decision tree was 0.9860, the recall rate was 0.9329, the precision was 0.9267, and the F1 score was 0.9298, which was superior to all other models. In addition, the random forest model also performed well in terms of accuracy and precision, but it was slightly inferior in recall rate and F1 score. In contrast, both the K-nearest neighbor and logistic regression models performed poorly overall, especially in terms of recall rate, accuracy and F1 score. The results of important characteristics(Figure 6)showed that income, family size and educational level were the three most important characteristics. Through the analysis of this paper, high-income customers with an annual income of 985,000 US dollars or more are the main force of personal loans because they have greater financial flexibility and broader investment and consumption upgrade goals. In addition, families with a size of no more than 2 are more willing to accept loans compared to large families because they have relatively fewer financial responsibilities and burdens. Furthermore, a higher educational background implies that customers have a deeper reserve of financial knowledge and better debt management capabilities, so customers with postgraduate or professional degrees are more likely to accept loans.
Based on the research results, this paper provides several suggestions for Neo Bank. First of all, the bank should segment customers based on their income levels and extract high-income individuals as a unique group. By analyzing the number and growth rate of customers' income over the years, the bank can determine which customers are the most promising high-income customers for loans, and then tailor marketing activities according to their needs. Secondly, the bank should design loan products that can attract small families. For example, it can use big data analysis to explore the consumption habits and capital flow characteristics of small family customers, thereby providing personalized customization of loan products. In addition, the bank can build partnerships with well-known educational institutions, professional associations or alumni organizations to offer exclusive loan services to customers with high educational standards. For instance, banks can collaborate with nearby universities to offer specific low-interest educational or entrepreneurial loans to university students. In terms of technology, the pre-pruning decision tree model was found to be the most accurate in loan prediction. Therefore, this paper advocates that Neo Bank apply this model to its prediction and marketing system. Based on the predicted results of this model, it can rate customers and dynamically adjust marketing strategies and activities, thereby maximizing the conversion rate. Furthermore, it can further refine their strategies by conducting A/B tests to evaluate the effectiveness of different marketing messages and channels.
In view of the limitations of this model discussed in the previous chapter of this article, Neo Bank needs to implement targeted optimization measures to improve the model's performance and decision fairness. Firstly, it can establish a dynamic model update mechanism to analyze real-time data and market trends, thereby reducing the limitations of lagging historical data and enabling the model to adapt to the rapidly changing financial environment. Secondly, building upon existing structured data, it is important to incorporate behavioral economics indicators such as customer risk preferences and consumption psychology to develop a more comprehensive evaluation system. To address data bias issues, the bank should create a balanced sample database covering various demographic characteristics (e.g., age, gender, region, etc.).
In summary, by combining precision marketing, customer-centric loan product design, and ongoing model optimization, Neo Bank can significantly improve personal loan conversion rates, solidify its customer-first brand image in the competitive financial market, and achieve long-term sustainable growth.
Acknowledgement
The authors declared no potential conflicts of interest with respect to the research, authorship, and/or publication of this article. Xingjia Lyu, Yihan Huang and Xuefei Liu contributed equally to this work and should be considered co-first authors. Jiangjiali Wang and Jiajia Han contributed equally to this work and should be considered co-second authors.