

1. Introduction
The outbreak of force majeure factors, such as epidemics and floods, has led to many economic problems: GDP decline, a significant increase in unemployment, a drop in export demand, a decrease in international trade income, many businesses halting operations, and economic downturns in industries such as tourism, entertainment, catering, and transportation, etc. Consumption is a window for observing the state of economic operations. Disasters lead to increased government fiscal expenditure, and the government issues national bonds to reduce fiscal deficits, resulting in a decrease in available market funds and a decline in residents' consumption desires [1]. However, as domestic control measures become normalized, industries such as catering, transportation, and tourism are gradually recovering. “The familiar hustle and bustle is back,” said the public. Flights and high-speed trains are bustling, popular tourist spots are crowded, trendy restaurants have long queues, cinemas and theaters are fully booked. The vibrant holiday economy is a vivid reflection of the recovery in the consumer market and strong evidence of the economy's steady improvement."
Consumption is a matter of national importance and concerns the welfare of every household. Consumption can be divided into two forms: material consumption and non-material consumption [2]. Material consumption refers to the purchase of various tangible goods and products, such as clothing, food, furniture, and electronic devices. Non-material consumption, on the other hand, focuses more on services and experiences, such as tourism, education, healthcare, and cultural entertainment. Both forms of consumption can satisfy different needs and desires of people. This study mainly focuses on the impact of force majeure factors on the consumption of Chinese residents, while also discussing the differences in consumption among residents in various provinces of China since 2015. The data used in this study primarily come from national and provincial statistical yearbooks.
Using the method of literature review analysis, this paper analyzes the changes in the per capita consumption expenditure and consumption structure of Chinese residents from 2015 to 2022, the changes in the urban-rural consumption gap, the impact of the epidemic on the consumption levels of Chinese residents and various regions, and concludes with a summary of the data as well as some recommendations for boosting the economy.
2. Changes in National Per Capita Consumption Expenditure and Consumption Structure
To study the impact of force majeure factors on the per capita consumption expenditure and consumption structure of Chinese residents, it is first necessary to analyze the normal conditions of these two aspects. Therefore, it is essential to analyze the trends in the per capita consumption expenditure of Chinese residents and the characteristics of the changes in the per capita consumption structure from 2015 to 2022.
2.1. Changes in National Per Capita Consumption Expenditure
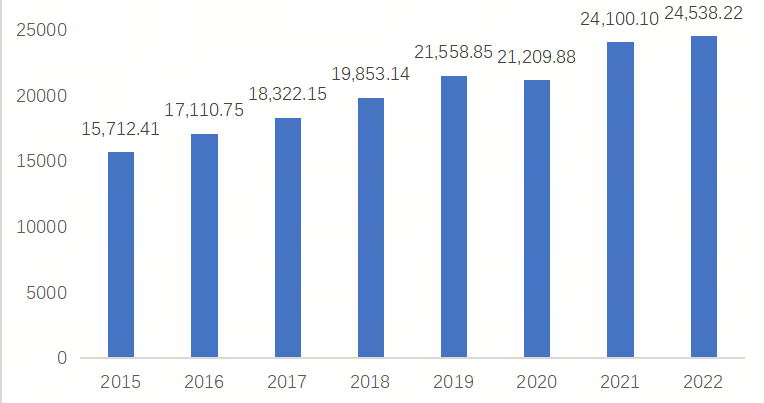
Figure 1: National Per Capita Consumption Expenditure from 2015 to 2022
As seen in Figure 1, from 2015 to 2019, the per capita expenditure of Chinese residents steadily increased: from ¥15,712.41 in 2015 to ¥21,558.85 in 2019. However, in 2020, due to force majeure factors, the per capita expenditure did not continue to rise as expected but instead dropped from ¥21,558.85 in the previous year to ¥21,209.88. After that, the per capita expenditure of Chinese residents slowly increased, reaching ¥24,100.10 in 2021 and ¥24,538.22 in 2022. The upward trend in per capita consumption expenditure is attributed to sustained economic growth and rising incomes. With economic development and the progress of urbanization, people’s income levels gradually increased, thereby promoting the growth of consumption expenditure.
2.2. Changes in Consumption Structure
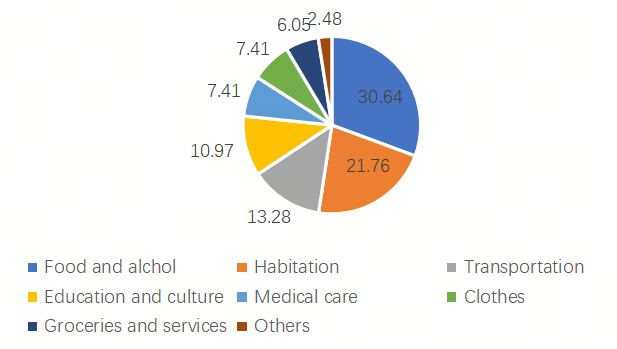
Figure 2: China's Resident Consumption Structure in 2015
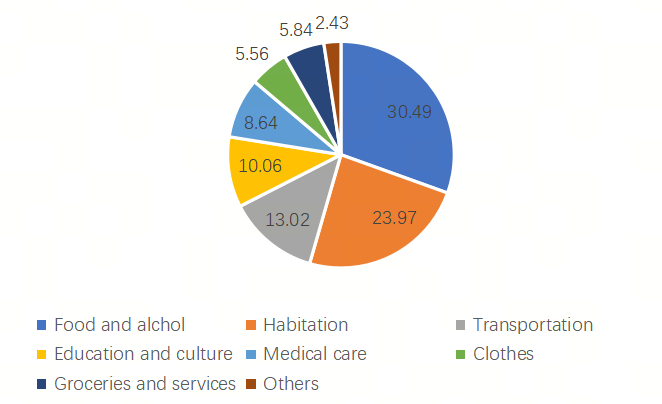
Figure 3: China's Resident Consumption Structure in 2022
In terms of the Engel coefficient, China’s Engel coefficient has been around 30% in recent years, which is relatively high. The lower a country’s Engel coefficient, the wealthier its people are [3]. For example, in 2023, the Engel coefficient was 8.3% in the United States and approximately 12.5% in the United Kingdom [4].
From 2015 to 2022, the epidemic positively affected certain categories in the consumption structure of residents, such as healthcare and housing. Conversely, the epidemic negatively affected categories such as clothing and education, culture, and entertainment. Categories with little to no change include other goods and services, household goods and services, transportation and communication, and food, tobacco, and alcohol. This might indicate that, under the influence of the COVID-19 pandemic, people increased their demand for essential healthcare and secure housing while reducing their demand for clothing and entertainment activities, which had minimal or negative impact on pandemic prevention.
3. Changes in the urban-rural gap in consumption
This chapter mainly includes an analysis of the changing characteristics of the urban-rural gap in per capita consumption of Chinese residents.
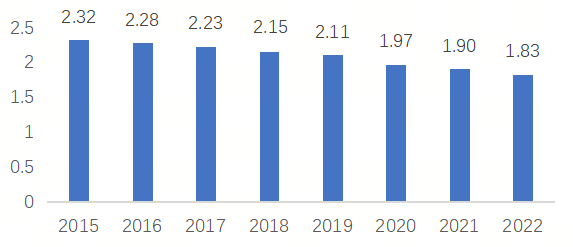
Figure 4: Urban-rural gap in per capita consumer expenditure from 2015 to 2022
Based on the general principle of comparing consumption expenditure, we can derive the formula for the ratio of urban to rural per capita consumption expenditure: Urban-rural per capita consumption ratio = Urban residents' per capita consumption expenditure / Rural residents' per capita consumption expenditure [5]. In 2015, the urban-rural gap ratio was 2.32, and in 2022, it was 1.83.
According to the data in Figure 4, the gap in per capita consumption expenditure between urban and rural areas has been narrowing at a slow rate each year, with cities and villages gradually moving towards the goal of common prosperity. Moreover, the epidemic has not hindered the narrowing of the urban-rural gap in the consumption levels of Chinese residents.
In recent years, the Chinese government has been committed to reducing the urban-rural gap, especially in terms of income and consumption. Through the promotion of reform and opening up, urbanization, and rural development policies, the economic development and income levels of rural areas have improved, thereby narrowing the urban-rural consumption gap [6].
The gap in per capita consumption between urban and rural residents is closely related to the income gap. Generally speaking, urban residents have relatively higher income levels, and therefore, they typically have higher consumption levels. Although the income of rural residents has increased, there is still a certain gap compared to urban residents, leading to the existence of the urban-rural consumption gap.
4. Impact of force majeure on consumption
This chapter mainly includes the analysis of the impact of force majeure on the consumption level of residents in China and various regions in the long and short term.
4.1. Impact of force majeure on consumption of Chinese residents
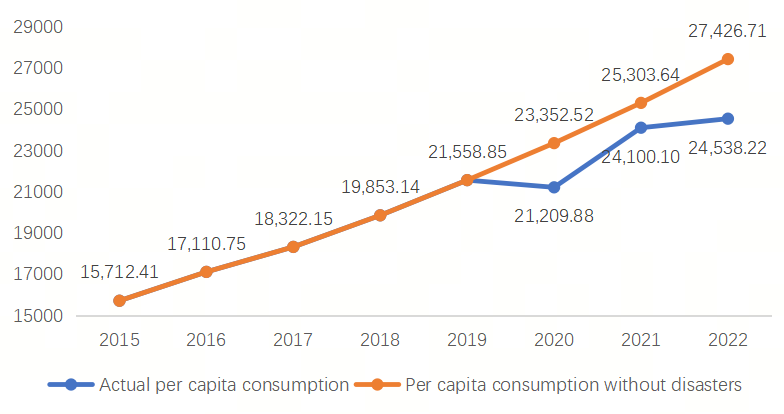
Figure 5: Impact of force majeure on Chinese Consumer Consumption
According to the figure, disasters significantly reduced the trend of per capita consumption expenditure among Chinese residents: according to the original trend, per capita consumption expenditure was expected to reach 23,352.52 yuan in 2020, 25,303.64 yuan in 2021, and 27,426.71 yuan in 2022. However, due to force majeure factors, actual per capita consumption expenditure was 21,209.88 yuan in 2020, 24,100.10 yuan in 2021, and 24,538.22 yuan in 2022. This represents a decrease of 2,142.64 yuan, 1,203.54 yuan, and 2,888.49 yuan for these three years, respectively, compared to expectations. From 2020 to 2022, actual expenditure was significantly lower than expected, mainly due to the substantial impact on offline non-essential goods markets (such as clothing, education, culture, and entertainment) during this period. Due to force majeure factors, most stores could not operate normally, and consumers' purchasing power declined, leading to a sharp decrease in their transaction volume. Additionally, disruptions in personnel and information exchanges exacerbated market information asymmetry, further disrupting market order.
4.2. Analysis of the impact of force majeure factors on different regions
In the short term, various regions in China were affected to varying degrees in 2020.
In most cities, more developed cities were more affected by the pandemic compared to relatively less developed cities. For example, in 2020, Beijing's consumption level dropped by 0.18%, and Shanghai's by 0.12%. In contrast, Yunnan Province's consumption level only decreased by 0.04%, and Qinghai Province's consumption level dropped by just 0.02%, showing almost no change.
In the medium to long term, from 2015 to 2022, the per capita consumption levels across different provinces in China have also experienced varying changes.
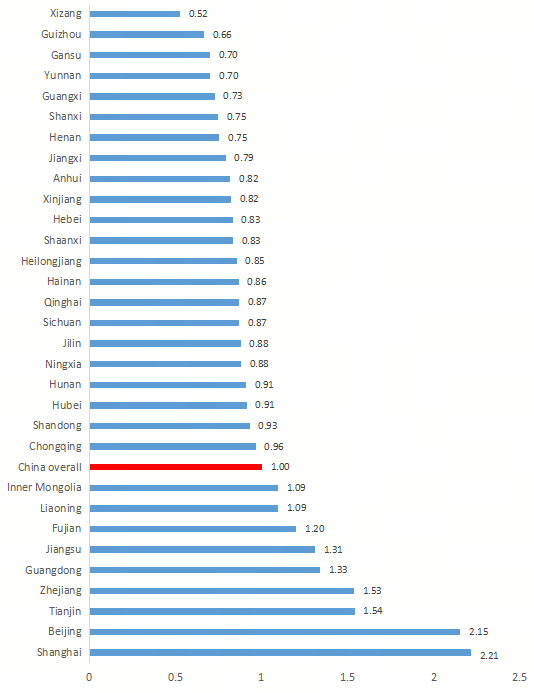
Figure 6: Per capita consumption level of each province in 2015
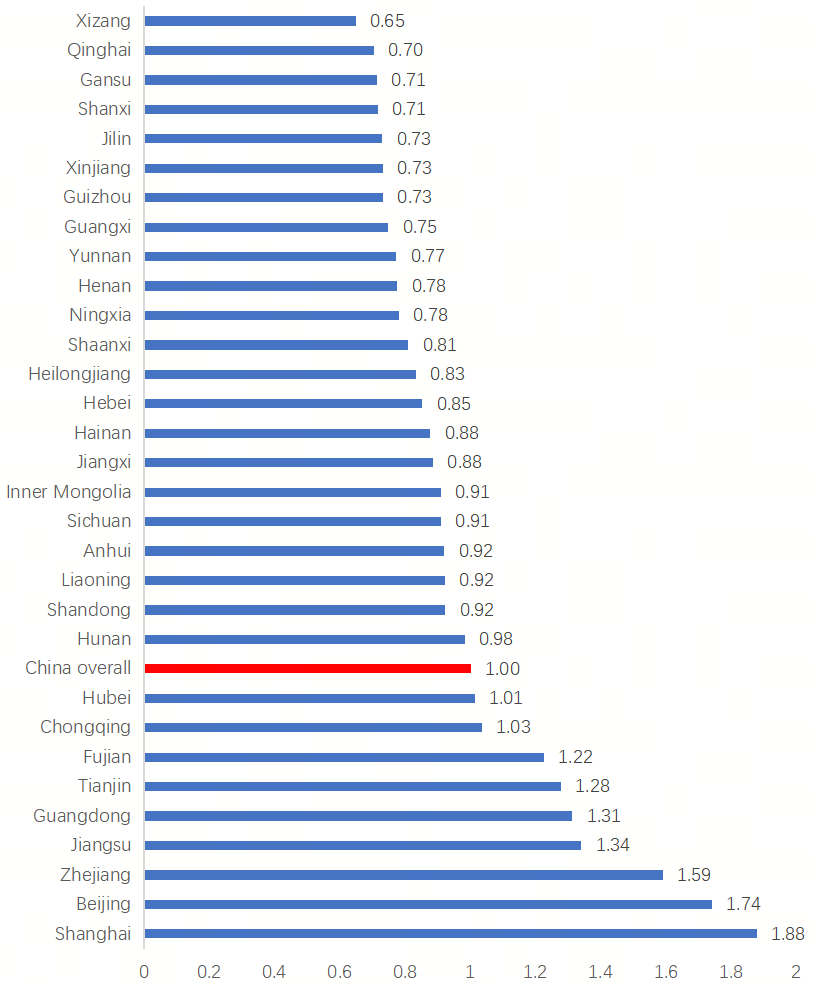
Figure 7: Per capita consumption level of each province in 2022
In 2015, Shanghai and Beijing ranked first and second in terms of per capita consumption levels relative to the national average, with ratios of 2.21 and 2.15, respectively. By 2022, these ratios had decreased to 1.88 for Shanghai and 1.74 for Beijing. Despite the decrease, these two municipalities remain the regions with the highest per capita consumption levels in China. On the other hand, Tibet Autonomous Region, which ranked last in 2015 with a per capita consumption ratio of 0.52 relative to the national average, saw an increase to 0.65 by 2022, still ranking last. Guizhou Province, which ranked second to last in 2015 with a ratio of 0.66, increased to 0.73 by 2022. Qinghai Province, which had a ratio of 0.87 in 2015, dropped to second to last place with a ratio of 0.70 in 2022. Most cities with high per capita consumption ratios relative to the national average in 2015 experienced a decrease by 2022, while cities with lower ratios in 2015 showed an increase, demonstrating a catching-up effect.
5. Conclusion
The impact of force majeure on Chinese household consumption is significant, notably reducing consumer spending in the first year of the pandemic, leading to a substantial decline in people's welfare. Despite this, the trend in per capita consumption did decrease, it did not prevent a narrowing of the urban-rural consumption gap or hinder improvements and optimizations in consumption structure. Force majeure factors had varying effects across different regions of China: in the short term, the impact was more pronounced in economically developed coastal areas, while remote and less developed regions experienced lower impact.
Over the longer term (2015-2022), there has been an increase in the urban-rural consumption gap between northern and southern regions. To enhance the current economic environment and welfare, the government should strengthen medical technology and social security to safeguard consumer activities. Encouraging entertainment and leisure spending can stimulate consumer activities. Increased efforts should be directed towards impoverished regions through poverty alleviation measures such as industrial development, employment support, and education. Enhancing technological innovation, social welfare, and employment support can elevate income levels, thereby boosting consumer demand and consumption levels. Continued implementation of policies like revitalizing Northeast China's old industrial bases and developing the western regions can help reduce regional disparities.