


1. Introduction
Since the beginning of the 21st century, China's transportation system has entered an era of rapid take-off, especially the metro system, which has entered a fully computerized and digital management mode. The Chinese government has been committed to optimizing the organization and safety of the metro system in order to improve its accessibility and operational efficiency, and as a result UN-owned companies have invested more effort and financial assistance in the integration of information sharing and emergency safety alerts. However, due to a series of problems such as relatively insufficient information infrastructure, deficient information sharing, inefficient widespread use, inadequate data value mining, poorly targeted safety alerts and insufficient investment in information processing, the value of information from various departments is scattered and information cannot be collected in a unified manner, which makes it more difficult for the transparency and interoperability of the urban metro transport system to provide a more convenient transport experience for the public[1]. This has created difficulties for the transparency and interoperability of information in urban metro systems and for providing a more convenient transport experience for the public. At the same time, compared to urban metro transportation systems in some developed countries, problems such as the degree of information system integration in each platform area, digital resources being too scattered to centralize the overall analysis of safety and early warning situations [2], and insufficient maintenance of information networks by artificial intelligence technologies need to be developed and improved by the government and relevant state-owned enterprises. This study aims to maintain the network security of the metro system while using the shared platform of the urban metro system as a basis to explore whether there is a positive correlation between its sensitivity to the safety warning of the metro system and the efficiency of passenger flow control.
2. Literature Review
2.1. Efficient centralisation of digital resources
In addition to controlling the metro stations, each city has a central metro traffic command centre with a good overview of all metro stations and all metro lines. In the face of such a complex and changing traffic situation, the central metro headquarters needs to allocate digital resources flexibly according to the flow of passengers at different times of the day. In simple terms, this means that the flow of passengers is digitized and visualized through digital software [4], allowing the management of the headquarters to see the flow of passengers on each line and to increase or decrease the frequency of the metro flexibly. If the ERP system is not perfect, the data collected will always be presented in a fragmented form, and the supervisors will not be able to fully understand the actual passenger flow of a particular line and make appropriate solutions in time, thus resulting in the breakdown of the metro system due to the passenger flow breaking the limit. Enterprise Resource Planning [5] means that Facilitates communication between researchers and practitioners. The case illustrated above is only a statistical analysis of a particular station, but if it is to face a comprehensive analysis of different stations and lines, then such a massive amount of data workload cannot be undertaken by human capacity; for this situation, the city's central metro ERP system not only to integrate data collection but also to carry out a comprehensive analysis and automatically provide appropriate and flexible solutions and implement them automatically [6]. A suitable and flexible solution here means that the collected data sets should be digitally visualized in their complete framework, and the number of frequencies allocated should be rationalized to arrive at a solution that avoids maintaining the frequency of frequencies in places with above-average patronage and not reducing the frequency of frequencies in places with below-average patronage. Therefore, the government needs to invest much money to upgrade the ERP system of the urban metro, To improve the ability to integrate data within the system, to improve its operational efficiency, to allocate digital visualization resources in a way that is appropriate to the local context, and to reduce the negative impact of the solution being infeasible due to the inappropriate allocation of digital resources, which ultimately avoids leading to the paralysis of some metro stations.
2.2. Information sharing on city metro networks
The ERP system of the urban metro transport command center not only allows for the rational allocation of digital resources according to local conditions but also allows for the establishment of a unified sharing platform based on the improvement of data integration capabilities to improve the efficiency of system automation and monitoring [7]. The monitoring systems of various departments are in different modes of operation, so to establish a sharing platform, it is necessary to establish a unified port facing the sharing platform to ensure that the database stored on the sharing platform is formatted and unified in the front-end port of the database and finally stored in the database of the sharing platform for further analysis and processing. At the same time, some long-term historical data should be transferred to the historical database for easy access and extraction in the future [8]. With the establishment of the foundation of the sharing platform, different departments can freely access each other and query the database of each other's monitoring system according to the unified ports of the sharing platform, strengthening information interoperability and cooperation between departments and conducting comprehensive tests and analysis of operational and traffic environment data to assess and predict possible unexpected situations. In contrast, the system platform automatically provides preferred and alternative solutions [9], and according to different situations as shown figure1, implementation is carried out. However, in the long term, the advantage of the shared platform is the ability to mine critical data, analyze past data information structure patterns and generate alternative scenarios in advance to deal with emergency traffic situations [10]. For safety alerts, the system regularly checks each other through the unified ports of each monitoring system, and whenever there is an abnormality, the system alerts and automatically fixes it. If the automatic fix does not work, the system automatically requests manual intervention. Therefore, the sharing platform is increasingly important in urban metro operations. The government should invest more funds and attract professionals to overcome the technical barriers to data integration, which dramatically improves operational efficiency and provides an opportunity to prevent unexpected traffic accidents that cause unnecessary traffic and economic losses.
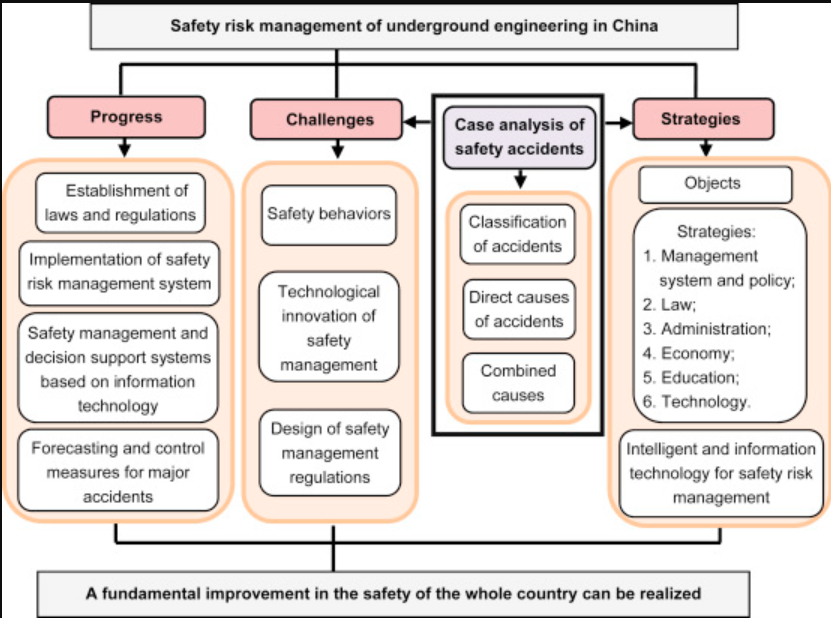
Figure 1: The structure flowchart of this study [11].
2.3. Metro Network Information Security
The normal operation of the urban metro system cannot be achieved without the support of the Internet. Without an Internet environment, the interoperability of the various departments of the metro with each other and the connectivity with the headquarters system would be significantly affected. It is undeniable that network security within the metro system is of paramount importance. The transport network of any city metro is intricate and complex, which means that the number of connection ports is not only increased but also set up in different models [12], and network hackers are likely to use the differentiation and multi-selectivity of metro network ports as a breakthrough to hack into the city's network security system. Once the metro network security system has been compromised, it can have a number of nasty effects. For example, in the case of China's urban network security systems, the operational train control equipment applied in China at this stage is imported, and the hardware lacks a certain level of security protection as well as the lack of local security markings and protection measures, so hackers can tamper and extract the internal system data through the compatibility of international train control equipment with the low level of embeddedness of the Chinese network system, eventually forcing the metro trains to accept the wrong As a result, some trains are forced to accept the wrong instructions for emergency braking, and some trains are forced to run with time difference as a loophole, resulting in a number of metro traffic accidents, resulting in casualties[13] and direct economic losses. In such cases, the government must take certain emergency measures to minimize the risk of cyber security. For example, maintaining the containment of train control equipment to avoid leaks during data transmission; strict security checks on external equipment, mobile transit stations and third service platform equipment, detection and removal of potential external cyber viruses; and vigorous training of professional cyber security engineers and technicians to ensure manual assistance in detecting system failures. According to such a 'three-no-go' defense-in-depth strategy can greatly improve the effectiveness of the metro system's network security. Secondly, cooperation should be carried out with companies in the country's network security to develop virus detection software or systems for the metro network security environment in line with the country's cities, to detect potential Trojan viruses in advance[14], to carry out systematic analysis and organizational modelling of detected network viruses transmitted to the software's internal database as shown on figure2, and also to automatically analyze the attack intentions of network hackers by systematically analyzing the fluctuation of network traffic[15]. Therefore, when similar network viruses invade again, the system can automatically carry out detection and take effective means of protection to ensure the integrity and non-leachability of the data and achieve the normal operation of the metro system.
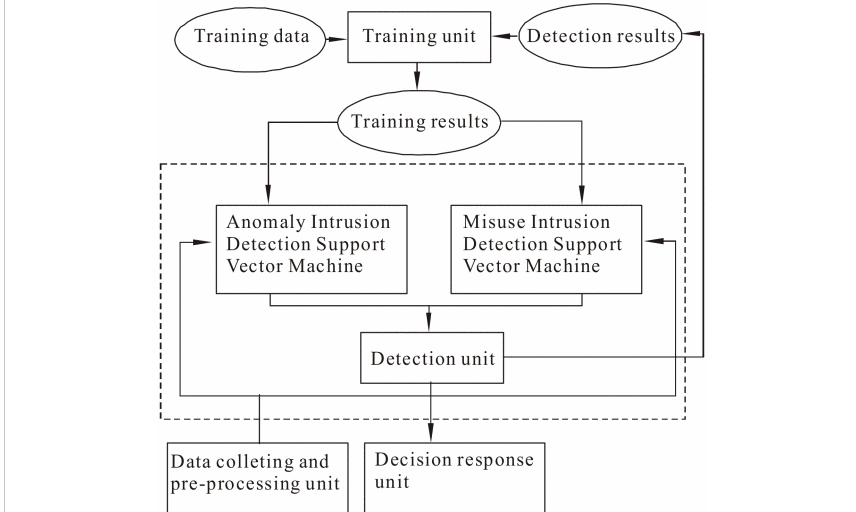
Figure 2: NIDS model based on Support Vector Machine [16].
2.4. Metro Safety Detection and Warning System
The effectiveness and speed of safety warnings is also a factor that cannot be ignored in the management of urban metros. First of all, as mentioned above, the frequency of the metro system is adjusted according to the number of passengers, but in the face of high passenger traffic, the increase in frequency inevitably increases the likelihood of collisions between trains. In this case, the metro management center must carry out a comprehensive test of the LIDAR detection system and the braking system in case of emergency [17], in order to minimize the possibility of traffic accidents. Secondly, the automation system of the metro trains must be equipped with the ability to analyze data in a comprehensive and localized way. For example, a number of machine language learning databases and software packages should be added to the automation system so that if the train encounters the same or a similar emergency safety situation each time, the system can quickly respond to the situation based on previous 'experience' to minimize the probability of a hazard occurring. If a new situation is encountered, it is also possible to carry out a strategy of braking first and then informing the command center and waiting for the next instruction. In this process, the system performs deep learning based on a complex machine language database and analyses and summarizes exactly what factors are involved in the pattern of similar time occurrences [18].
3. Materials and Methods
This study draws on a database of selected urban metro systems in China. The relationship between the name of the city, the level of development, the level of sophistication of the shared platform of the city metro system, the efficiency of passenger flow control (under the same conditions of passenger density) and the sensitivity of safety warnings are investigated. Firstly, the relationship between the size of the city and the level of development of the shared platform of the metro system will be studied and analyzed. This is because the degree of development of the sharing platform depends to a certain extent on the size of the city, i.e. the economic base determines the superstructure. Secondly, the relationship between the degree of sophistication of the shared platform, the efficiency of passenger flow control and the sensitivity of safety warnings in a city's metro system are investigated. The hypothesis test (H0) treats the degree of sophistication of the shared platform as a constant factor, i.e. the dependent variable, and therefore investigates how it affects the efficiency of passenger flow control and the sensitivity of safety warnings as a function of city class. Ultimately, it is investigated whether the level of sophistication of the shared platform has a positive relationship with the efficiency of passenger control and the sensitivity of safety warnings.
4. Results
Figure 3 shows that there is a positive correlation between the degree of development of a shared platform in a city's metro system and the size of the city itself. In other words, the larger scale of the city itself, such as Beijing, Shanghai and Guangzhou, the more advanced in development of metro sharing platforms. Figure 4 shows whether the sensitivity of safety warnings and the efficiency of passenger flow control in urban metro systems, as constant factors, are positively correlated with the level of development of shared platforms depending on the size of the city. The results clearly show that the sharing platform's development level is positively correlated with both. Combining Figure 3 and Figure 4, it can be concluded that in cities with high development scale such as Hong Kong, Shanghai and Hangzhou, the shared platform of the urban metro system is relatively well developed and therefore the sensitivity of the metro system in terms of safety warnings and the efficiency of passenger flow control is higher. In contrast to smaller cities such as Jinan, Taiyuan and Shijiazhuang, where the development of the shared platform is relatively basic, there is much room for improvement in the efficiency of the system in controlling passenger flows and detecting dangerous incidents during peak periods. From Regression analysis as shown in table 1, The fact that R Square is approximately equal to 0.88 indicates that approximately 88% of the data in the model can be interpreted intuitively, and therefore both the database selected, and the model built are amenable to inference testing by conducting hypotheses. From the results of the ANOVA Analysis, it is known that the Significance F-value is less than or equal to 0.05, proving that the test is more effective and allows a more intuitive look at whether the hypothesis test proves that the original hypothesis is valid, thus overturning the opposing hypothesis. From the last table in the column of passenger flow control efficiency, the p-value is less than 0.05, proving that the original hypothesis is valid in the experiment that discusses the positive relationship between the advanced index of the system sharing platform and the passenger flow control efficiency. In contrast, the column for the sensitivity of the security warning shows a p-value approximately equal to 0.1 greater than 0.05, indicating that the original hypothesis is not valid.
5. Discussion
While the hypothesis testing tests largely prove the original hypothesis to be valid, some errors caused by additional factors can have an impact on the results. Firstly, from Figure 3, a small number of high scale cities have a less developed metro system sharing system than some relatively developmentally basic cities have a metro system sharing platform, which may be an error caused by the interpretability of a small portion of the data information. Secondly, according to Table 1, in the experiment where the regression analysis was carried out, the data on the metro system safety sensitivity index was very similar in absolute value to the metro sharing platform development index, resulting in insignificant results and ultimately a p-value of approximately 0.1 and thus greater than 0.05. The overall analysis of the experiment still has its limitations, as this experiment was conducted on a selection of Chinese metro cities. Only 28 cities were selected, which is too small a sample size and has a large margin of error.
Figure 3: Development of shared urban metro platforms in China.
Figure 4: Positive correlation between system shared platform index and passenger flow control efficiency and safety warning.
Table 1: Regression Analysis.
SUMMARY OUTPUT | ||||||
Regression Statistics | ||||||
Multiple R | 0.938917357 | |||||
R Square | 0.881565804 | |||||
Adjusted R Square | 0.872091068 | |||||
Standard Error | 0.168065858 | |||||
Observations | 28 | |||||
ANOVA | ||||||
DF | SS | MS | F | Significance F | ||
Regression | 2 | 5.256257896 | 2.628128698 | 93.04384151 | 2.62098E-12 | |
Residual | 25 | 0.706153318 | 0.028246133 | |||
Total | 27 | 5.962410714 | ||||
Coefficients | Standard Error | T Stat | P-value | Lower 95% | Upper 95% | |
Intercept | -0.035211004 | 0.392117877 | -0.089796988 | 0.929164096 | -0.842792889 | 0.77237088 |
Passenger flow control | 5.871422825 | 1.139690068 | 5.151771511 | 2.51782E-05 | 3.524187191 | 8.218658458 |
Safety Warning Sensitivity | -2.297234337 | 1.376704896 | -1.668646918 | 0.107665364 | -5.132611089 | 0.538142416 |
6. Conclusion
Although some cities such as Beijing, Shanghai and Guangzhou have network sharing platforms with high sensitivity to safety warning levels and efficient passenger flow control. However, there are still many areas for improvement. Firstly, the extent to which metro warning mechanisms and passenger flow control systems are linked to the shared platform. Both the metro warning mechanism and the passenger flow control system that has been mentioned above are individual subsystems. For example, if at any given moment the passenger flow control system at a metro station makes a wrong judgement about the passenger flow capacity, resulting in the number of passengers seriously exceeding expectations. Under this kind of circumstance, the passenger flow tracking and detection system whether can transmit the passenger flow data to the shared platform in the first instance, which in turn transmits it to the central system of the city metro for manual decision making. As a result, the shared platform's data analysis system then can accurately capture the key causes of the incident and implement flexible solutions in subsequent similar incidents. By analogy, the same scenario can be applied to the metro safety inspection system. There is still a need to improve the level of interconnection between the layers of subsystems and shared platforms and the central system of the city metro, as well as to strengthen the analytical learning capabilities of the central metro system. Secondly, the uneven development of shared platforms due to the different sizes of cities, and the need to address the uneven development of metro systems in cities such as Jinan, Shijiazhuang and Taiyuan, which are lagging behind in terms of the development of metro systems, should be taken as a standard for cities with a higher level of metro system development, combined with the city's own environmental factors to improve the level and speed up the development of metro systems. Consequently, a more flexible and rational allocation of digital resources in urban metro operating systems can improve the operational efficiency of the digital sharing platform and simplify the internal structure of it. It is clear from Figure 4 that an increase in the operational efficiency (development index) of the shared platform can enhance the sensitivity of the metro system's safety warnings and the efficiency of passenger flow control, thus reinforcing the positive correlation between the development of the shared platform and these two factors.