

1. Introduction
Technology transfer is an important means of scientific and technological innovation [1, 2] and an important way to promote the economic and social effectiveness of scientific and technological achievements. At the same time, the economic development of the Beijing-Tianjin-Hebei region is seriously unbalanced. Therefore, the state proposed the "Beijing-Tianjin-Hebei Coordinated Development Strategy" to promote economic cooperation, balance economic differences, and enhance the overall economic strength of the Beijing-Tianjin-Hebei region [3].
As for the first question: to calculate the explained variables, DEA, as a common efficiency measurement method, can be calculated based on limited samples. Therefore, the author uses DEA method to measure the technology transfer efficiency in Beijing, Shanghai and Shenzhen [4]. At the same time, in order to enhance the verification accuracy, the DEA-SBM model proposed by Tone[5] calculated the green production efficiency of grain, overcoming the shortcomings of the traditional DEA model which only calculated the production technical efficiency including the expected output. The traditional CCR and the improved SBM method in the DEA model were respectively used to calculate the green production efficiency.
About the second question: This paper takes the two dimensions that affect the improvement of technology transfer efficiency as the explained variables to measure the mechanism of the Beijing-Tianjin-Hebei coordinated development strategy.
2. Research design
In this paper, hypotheses are first proposed, and descriptive analysis of research data and variables is carried out. Empirical data are from China Urban Statistical Yearbook, China Urban Construction Statistical Yearbook and China Science and Technology Statistical Yearbook. The traditional CCR method of DEA model is used to calculate the technology transfer efficiency of explained variables. At the same time, in order to comprehensively consider the influence of "relaxation variable" and "undesired output" on the efficiency value, thirdly, based on the DID model, two basic regression analyses were carried out on the relevant hypotheses by using the technology transfer efficiency values calculated by DEA CCR and SBM methods, combined with explanatory variables and control variables. Then, to ensure the accuracy of the study results, a mechanism test and a placebo test were performed, and finally a heterogeneity analysis was performed.
This article uses the CCR model to calculate the efficiency of technology transfer, using internal R&D expenditure and the full-time equivalent of regional R&D personnel as inputs, and the number of regional invention patent applications and regional invention patent authorizations as outputs. As shown in Table 1:
Table 1: CCR Model Indicator System for Measuring Technology Transfer Efficiency
|
Input Indicators |
Output indicators |
||
|
Internal R&D Expenditure |
Regional R&D Personnel Full-Time Equivalent |
Number of Regional Invention Patent Applications |
Number of Regional Invention Patent Authorizations |
This article uses the SBM model to calculate the efficiency of technology transfer, using internal R&D expenditure and the full-time equivalent of regional R&D personnel as inputs, and the number of regional invention patent applications and regional invention patent authorizations as outputs. The emissions of industrial wastewater, industrial sulfur dioxide, and industrial smoke and dust are regarded as unexpected outputs, as shown in Table 2:
Table 2: SBM Model Indicator System for Measuring Technology Transfer Efficiency
|
Input indicators |
Expected output indicators |
Unexpected output indicators |
||||
|
Internal R&D Expenditure |
Regional R&D Personnel Full-Time Equivalent |
Number of Regional Invention Patent Applications |
Number of Regional Invention Patent Authorizations |
Industrial Wastewater Discharge |
Industrial Sulfur Dioxide Emissions |
Industrial Smoke and Dust Emissions |
3. Setting a DID model to evaluate policy effectiveness
This paper identifies 2014 as the starting year when the central government first proposed the Beijing Tianjin Hebei coordinated development strategy. A total of 30 major provinces and cities across the country, including the Beijing Tianjin Hebei region, are selected as experimental groups to analyze data from 12 years before and after the implementation of the policy in 2014, from 2008 to 2019. Among them, the dependent variable Effectivenessit is calculated using DEA model, SBM and CCR methods, using internal R&D expenditure from 30 provinces and cities, full-time equivalent of regional R&D personnel as inputs, and regional invention patent application volume to obtain two types of dependent variable data. The relevant data for controlling variables mainly comes from the 《China Urban Statistical Yearbook》 and《The provincial statistical yearbook》. Table 3 shows the research variables and specific calculation methods.
Table 3: Studying Variables and Calculation Methods
|
Variable Type |
Variable Name |
Variable Meaning |
Method of Calculation |
|
Explained Variable |
Effectiveness |
Representative Technology Transfer Efficiency |
Calculate Using the CCR and SBM Methods In the DEA Model Separately |
|
Explanatory variable |
Policy |
Representing the Coordinated Development Policy of Beijing -Tianjin -Hebei |
Dummy Variables (0,1) |
|
Control Variable 1 |
Urban Development Scale |
Representative Urban Development Scale |
Expressed by Calculating Urban Population Density, in People Per Square Kilometer |
|
Control variable 2 |
Degree of Industrial Agglomeration |
Degree of Industrial Agglomeration in Representative Cities |
Calculate by Dividing the Number of Employed Persons (10000 people) by the Administrative Area (Square Kilometers) |
|
Control variable 3 |
Government Financial Capacity |
Representing the Financial Capacity of the Government |
Calculated by Dividing Government Expenditure by GDP |
|
Control variable 4 |
Government Expenditure Structure |
Representing the Structure of Government Fiscal Expenditure |
Calculated by Dividing the Expenditure on Science and Technology in Local Finance by the Expenditure on Education in Local Finance by the General Budget Expenditure in Local Finance |
4. Measurement Results of Technology Transfer Efficiency
Using Stata software, data from 30 major provinces and cities in China from 2008 to 2019 were selected. The CCR and SBM methods in the DEA model were used to calculate the technology transfer efficiency of the 30 major provinces and cities in China. For ease of reading.
Table 4 display the technology transfer efficiency values measured using the CCR and SBM methods in Beijing, Tianjin, and Hebei.
Table 4: Efficiency values of technology transfer in the Beijing Tianjin Hebei region calculated using CCR and SBM methods
|
Year |
Beijing Technology Transfer Efficiency Value |
Tianjin Technology Transfer Efficiency Value |
Hebei Technology Transfer Efficiency Value |
|||
|
CCR |
SBM |
CCR |
SBM |
CCR |
SBM |
|
|
2008 |
0.467739737 |
1 |
0.503466949 |
0.539752077 |
0.508915442 |
0.22155121 |
|
2009 |
0.288029002 |
1 |
0.301851029 |
0.520041197 |
0.219140754 |
0.206186224 |
|
2010 |
0.302592737 |
1 |
0.337402547 |
0.517334126 |
0.349184639 |
0.206884173 |
|
2011 |
0.497981735 |
1 |
0.506873898 |
0.61107342 |
0.517313952 |
0.175352486 |
|
2012 |
0.193821549 |
1 |
0.210297819 |
0.332871793 |
0.234914475 |
0.177035411 |
|
2013 |
0.266843779 |
1 |
0.284893679 |
0.623457683 |
0.284182091 |
0.190929027 |
|
2014 |
0.255857278 |
1 |
0.245685652 |
0.658379694 |
0.254765323 |
0.22884987 |
|
2015 |
0.138039611 |
1 |
0.155289135 |
0.767097881 |
0.152841381 |
0.275848196 |
|
2016 |
0.292551421 |
1 |
0.217417765 |
1 |
0.224569396 |
0.295899466 |
|
2017 |
0.164621644 |
1 |
0.181926717 |
1 |
0.169121364 |
0.358990093 |
|
2018 |
0.16311852 |
1 |
0.160895388 |
1 |
0.172996249 |
0.468846167 |
|
2019 |
0.460820573 |
1 |
0.467739737 |
1 |
0.503466949 |
0.513102017 |
5. DID model regression results
In order to explore whether the Beijing-Tianjin-Hebei coordinated development strategy has a positive impact on technology transfer efficiency, the DID benchmark regression model is used for estimation, in which the explanatory variable is based on the technology transfer efficiency calculated by CCR (see Table 5). model 1 in Table 5 does not consider the influence of control variables and the influence of time effect. Model 2 took control variables into account, but DID not consider the influence of time effect. Did coefficient decreased from 0.362 in model 1 to 0.260, and was significantly positive at 5% level, indicating that the addition of control variables alleviated the problem of missing variables. At the same time, the goodness of fit of Model 2 increased significantly compared with Model 1 (from 0.146 to 0.344), with a high explanatory force, which fully proves that the Beijing-Tianjin-Hebei coordinated development strategy has a positive impact on the technology transfer efficiency of the three regions of Beijing, Tianjin and Hebei.
Tabel 5: Basic regression using CCR method to calculate the efficiency value of technology transfer as the dependent variable
|
(1) |
(2) |
(3) |
||
|
VARIABLES |
Et_Ct |
Et_Ct |
Et_Ct |
|
|
did |
0.362*** |
0.260*** |
0.194*** |
|
|
(0.0463) |
(0.0423) |
(0.0384) |
||
|
Urban development scale |
0.0806*** |
0.0602*** |
||
|
(0.0149) |
(0.0136) |
|||
|
Degree of industrial Agglomerative |
0.101 |
0.372 |
||
|
(0.372) |
(0.333) |
|||
|
Government financial capacity |
0.784*** |
0.576*** |
||
|
(0.136) |
(0.128) |
|||
|
Government expenditure structure |
1.336*** |
1.759*** |
||
|
(0.386) |
(0.357) |
|||
|
Year FE |
No |
No |
Yes |
|
Table 5: (continued). |
||||
|
Constant |
0.400*** |
-0.471*** |
-0.420*** |
|
|
(0.0103) |
(0.109) |
(0.100) |
||
|
Observations |
360 |
360 |
360 |
|
|
R-squared |
0.146 |
0.344 |
0.499 |
|
Standard errors in parentheses
*** p<0.01, ** p<0.05, * p<0.1
In order to enhance the rigor of verification, the explanatory variables in this paper were again used to perform basic regression based on the technology transfer efficiency calculated by SBM (see Table 6).
Tabel 6: Basic regression using SBM method to calculate the efficiency value of technology transfer as the dependent variable
|
Model |
(1) |
(2) |
(3) |
|
VARIABLES |
Et_Ct |
Et_Ct |
Et_Ct |
|
did |
0.190** |
0.155** |
0.121** |
|
(0.0838) |
(0.0603) |
(0.0608) |
|
|
Urban development scale |
0.000302 |
-0.000514 |
|
|
(0.000185) |
(0.000458) |
||
|
Degree of industrial Agglomerative |
-2.353 |
-1.233 |
|
|
(3.296) |
(3.916) |
||
|
Government financial capacity |
1.063*** |
2.308*** |
|
|
(0.252) |
(0.322) |
||
|
Government expenditure structure |
1.049 |
-0.189 |
|
|
(0.702) |
(0.763) |
||
|
Constant |
0.475*** |
-0.0496 |
0.233 |
|
(0.0416) |
(0.167) |
(0.199) |
|
|
Individual-fixed-effects |
no |
no |
yes |
|
Observations |
360 |
360 |
360 |
|
R-squared |
0.0259 |
0.112 |
0.181 |
|
Number of id |
360 |
360 |
360 |
Standard errors in parentheses
*** p<0.01, ** p<0.05, * p<0.1
6. Parallel Trend Test
Figure 1 reports the policy estimation coefficients and their 95% confidence intervals. As shown in the figure, in the years after the implementation of the Beijing Tianjin Hebei coordinated development policy, the regression coefficients of policy variables are significant (95% confidence interval does not include 0), indicating that there is a significant difference in the trend of change between the experimental group and the control group after the implementation of the Beijing Tianjin Hebei coordinated development strategy. When using the coordinated development strategy of Beijing Tianjin Hebei as the dependent variable, the regression coefficient of technology transfer efficiency changes from insignificant before policy implementation to significant positive. Therefore, the double difference model passes parallel trend testing.
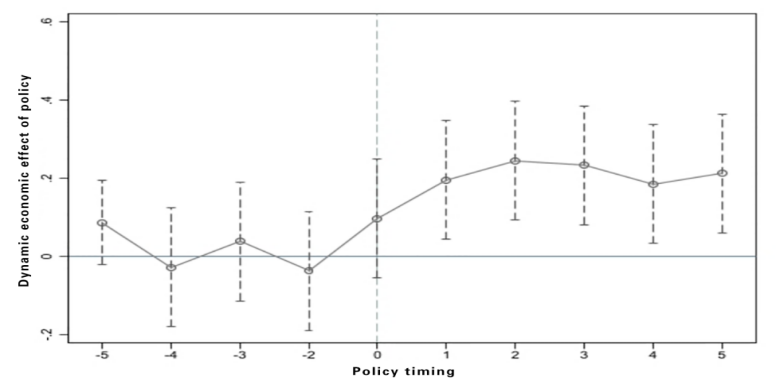
Figure 1: Using parallel trends to test the DID model
7. stability test
Figure 2 shows that the coefficients estimated by DID after random sampling are mostly not significant, and the true coefficient values estimated by benchmark regression fall at the end of the random sampling distribution map, which is significantly different from the mean coefficient obtained by placebo test, indicating the randomly selected treatment group. In the 1000 random sampling experiments mentioned above, there was no significant change in the efficiency of technology transfer, indicating that the estimation results of the benchmark regression are relatively robust.
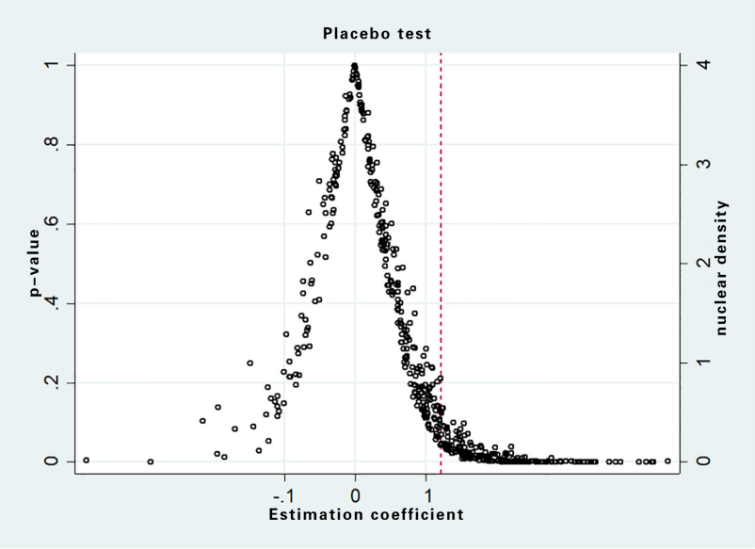
Figure 2: Perform placebo test based on DID model
8. Conclusion
Our paper draws three conclusions. First, the Beijing-Tianjin-Hebei coordinated development strategy has a positive impact on the efficiency of technology transfer in the three regions. Second, the strategies related to the coordinated development of Beijing, Tianjin and Hebei can promote the development of technology markets and information sharing capabilities of the three places, deepen the technical exchanges and cooperation between enterprises in the three places, and further promote the improvement of regional technology transfer efficiency. Third, it is suggested that the domestic continue to deepen the regional coordination policy to further promote the efficiency of technology transfer, so as to enhance regional economic development.