


1. Introduction
In today’s world, customer retention has become an important factor for companies seeking to sustain growth and profitability [1,2]. The telecommunications industry, in particular, faces a big challenge in the form of customer churn. Churn pertains to when clients decide to abandon a company and its services either because they are dissatisfied with what they receive or because they have found better alternatives from other companies [3,4]. This can lead to a possible reduction in the company's earnings and profitability [5]. Therefore, customer churn prediction becomes a powerful way to distinguish the customer who may churn.
Companies can use Machine Learning this technique to help them create a reliable prediction for the customer leaving [6]. Random Forest, Naive Bayes, and Decision Tree are three popular techniques that are commonly used in machine learning, broadly leveraged for classification problems. This article will test those methods to find an appropriate way to create an accurate prediction.
The following chapters are arranged as follows: Section 2 outlines the methodologies and datasets utilized for churn prediction. Section 3 details the obtained results from said methodologies. Section 4 provides a discussion of these results. Finally, Section 5 concludes the paper and analyses the corresponding limitations.
2. Method
2.1. Dataset
This prediction was based on the Cell2Cell Dataset [7]. It is among the biggest wireless companies in the US. The dataset contains 71,047 samples and each one has 58 attributes. In this dataset, 80% of samples are leveraged for training and the remainder for testing. This dataset consists of several groups below. In subscriber demographics and lifestyle, there are “Income Group”, “Prizm Code”, “Owns Motorcycle”, “Occupation”, and “Marital Status”. The plan details and usage include “Total Recurring Charge”, “Monthly Revenue”, “Monthly Minutes”, “Director Assisted Calls”, “Roaming Calls”, and “Overage Minutes”. As for the usage patterns and changes, there are “Perc Change Minutes”, “Perc Change Revenues”, and “Made Call To Retention Team”. The credit and financial information include “Adjustments To Credit Rating”, “Credit Rating”, and “Handset Price”. Finally, the referral behavior includes “Referrals Made By Subscriber”.
2.2. Decision tree
It is a useful supervised algorithm that works by dividing the data into subsets. In this model, a tree-like architecture is generated, which nodes represent features, branches denote feature values, and leaves are classifications [8]. The root of the tree represents the most important feature. The utilization of a decision tree aims to construct a model for training which is capable of predicting targets. This is achieved by learning uncomplicated decision rules from the gathered training data.
2.3. Random forest
It is a boosting algorithm, which combines several weak classifiers to boost performances. It selects random subsets of training samples for growing the trees [9]. A parameter m is leveraged to split the nodes for separating the total number of descriptors, where the selected features for septation is much smaller than the total features. Standard random forests integrate several tree predictors learning from the same distribution in the forest.
2.4. Naïve Bayes
It is constructed based on the Bayes' theorem [10]. The equation
\( P(X|Y)=P(Y|X)P(X)/P(Y) \) (1)
is Bayes’ theorem. According to Bayes' Theorem, the likelihood of a specific predicted event based on the evidence at hand is determined by three other variables. These include the probability of that prediction occurring in similar situations without the current evidence (known as the prior probability), multiplied by the probability of the current evidence given that the predicted event is true, divided by the overall probability of the predicted event occurring.
2.5. Evaluation indexes
For the churn prediction problem, there are several variables used to measure the various effectiveness of the compared classifiers.
Confusion Matrix: A two-by-two table that records the counts of true positives (TP), true negatives (TN), false positives (FP), and false negatives (FN) for a given prediction model. It provides valuable insight into the accuracy of churn prediction problems.
Accuracy: A measure of the overall correctness of a prediction model, computed as the proportion of correctly classified observations (i.e., TP and TN) to the total number of observations (i.e., TP, TN, FP, and FN). Mathematically, it can be expressed as the number of correctly classified samples over that of the entire samples.
Precision and Recall: These are two key metrics used in evaluating the performance of a churn prediction model. Precision is calculated as TP / (TP + FP), where TP represents the true positives and FP represents the false positives. Recall, on the other hand, is calculated as TP / (TP + FN), where FN represents the false negatives.
3. Result
3.1. Feature correlation
A heatmap is a graphical tool that represents numerical data in a matrix format through color coding. This visualization technique is often used to represent data in a manner that highlights patterns and trends in the underlying data. The colors within a heatmap are selected to represent different levels of data intensity, which can be used to convey information such as the frequency of an event or the performance of various metrics in the dataset. The selection of color schemes is often based on the specific needs of the business or organization presenting the data.
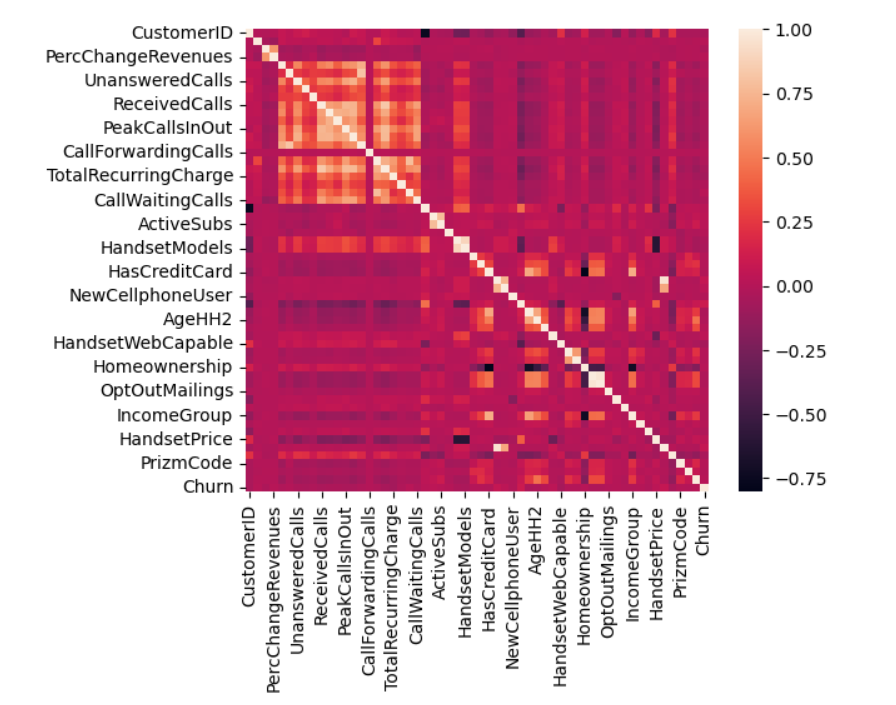
Figure 1. Feature correlations.
Above is Figure 1, which displays a heatmap of the correlations among the variables. The accompanying color palette indicates the degree of correlation between the variables. The lighter shade represents a high correlation. It could be observed that there are several variables that are important such as TotalRecurringCharge, RoamingCalls, DroppedCalls, CustomerCareCalls, OutboundCalls, and OffPeakCallsInOut. Those variables show a correlation to churn.
3.2. Effectiveness of max depth in decision tree
Table 1 is about decision tree method. It shows that the highest accuracy is 72.15%. The highest precision is 72.54% when Max Depth is 5. It also shows that the highest recall is 99.57% when Max Depth is 3. The difference between those results is small, so Max Depth is not a significant parameter in the Decision Tree method.
Table 1. Effectiveness of max depth in decision tree model.
Max Depth | Accuracy | Precision | Recall |
Max Depth=3 | 72.00% | 72.05% | 99.57% |
Max Depth=4 | 72.12% | 72.21% | 99.33% |
Max Depth=5 | 72.15% | 72.54% | 98.39% |
Max Depth=6 | 72.14% | 72.49% | 98.54% |
Max Depth=7 | 72.05% | 72.68% | 97.75% |
3.3. Effectiveness of parameters in random forest
For simplification, NE is short for N Estimators, MF is short for Max Features, and MD is short for Max Depth. Based on Table 2, the highest accuracy is 72.63% when NE is 50, MF is ‘sqrt’, and MD is None. The highest precision is 73.38% when NE is 50, MF is ‘sqrt’, and MD is 50. The highest recall is 98.63% when NE is 150, MF is ‘log2’, and MD is 50.
Table 2. Effectiveness of parameters in random forest.
NE | MF | MD | Accuracy | Precision | Recall |
50 | log2 | None | 72.20 | 72.90 | 97.43 |
50 | log2 | 50 | 72.19 | 72.90 | 97.43 |
50 | log2 | 100 | 72.20 | 72.90 | 97.43 |
50 | sqrt | None | 72.63 | 73.32 | 97.17 |
50 | sqrt | 50 | 72.54 | 73.38 | 97.17 |
50 | sqrt | 100 | 72.63 | 73.32 | 97.17 |
40 | log2 | None | 72.04 | 72.90 | 97.08 |
40 | log2 | 50 | 72.12 | 72.96 | 97.06 |
40 | log2 | 100 | 72.04 | 72.90 | 97.08 |
40 | sqrt | None | 72.46 | 73.33 | 96.78 |
40 | sqrt | 50 | 72.39 | 73.26 | 96.80 |
40 | sqrt | 100 | 72.46 | 73.33 | 96.78 |
150 | log2 | None | 72.58 | 72.78 | 98.62 |
150 | log2 | 50 | 72.59 | 72.78 | 98.63 |
150 | log2 | 100 | 72.58 | 72.78 | 98.62 |
150 | sqrt | None | 72.54 | 72.96 | 98.02 |
150 | sqrt | 50 | 72.50 | 72.94 | 97.96 |
150 | sqrt | 100 | 72.54 | 72.96 | 98.02 |
The table demonstrates that the result of “Max Depth = None” and the result of “Max Depth = 100” is the same in most of the cases. When Max Features is ‘log2’, the result has a higher recall, but when Max Features is ‘sqrt’, the result has higher accuracy and precision. It could also be noticed that N Estimators = 50 can create a better result on accuracy and precision.
3.4. Result of Naïve Bayest
Since Naive Bayes does not have any important parameters, it is a straightforward result. The accuracy is 68.44%, the precision is 72.72%, and the recall is 89.57%.
3.5. Result comparison
To organize the information from the previous result, the decision tree can predict the highest recall which is 99.57% when the Max Depth is 3, and the random forest can predict the highest accuracy which is 72.63% (NE is 50, MF is ‘sqrt’, and MD is None) and the highest precision which is 73.38% (NE is 50, MF is ‘sqrt’, and MD is 50).
The confusion matrixes illustrated in Figure 2 are created from Random Forest, Decision Tree, and Naive Bayes. In this matrix, 0 represents the customer who stays in the company, and 1 represents the customer who leaves the company. For example, “Y predict is 1, and Y test is 0” represents the customers who stay in the company but the machine predicts that they will leave.
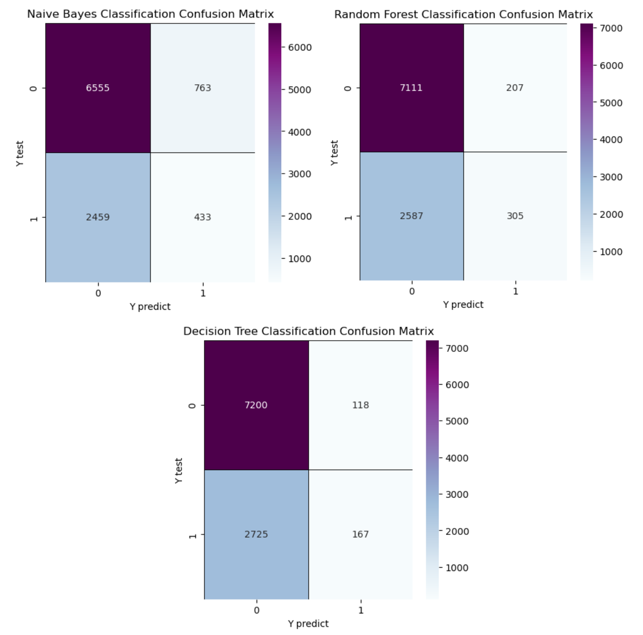
Figure 2. Confusion matrixes of three models.
4. Discussion
Table 2 shows several parameters, but the most change in parameters does not make a significant improvement to the accuracy. There is no need to add the Max Depth, but N Estimators and Max Features are meaningful parameters to use depending on different focuses for accuracy or recall.
There is an almost perfect accurate recall from the decision tree which is 99.57% when the Max Depth is 3. However, to consider which variables- which are accuracy, precision, and recall- are the best way to measure those three methods, people need to think about the purpose of churn estimation. The aim of the estimation is to redeem the customer who wants to leave. FN, which is at the top right position in the matrix, represents a kind of wrong prediction that the machine predicts the customers will leave the company but that customers actually stay in this company. This kind of wrong prediction is less important because those customers still stay in the company and there is no need to save them back. In other words, recall is not an appropriate way to score those three methods, because Recall = TP / (TP + FN), and it is unnecessary to consider FN.
The accuracy and precision are both useful measurements to test the method. It is obvious that the Random Forest model performs superior than other models and the highest precision. However, in real-life cases, the Naive Bayes model might be the most appropriate method, because the main points for this prediction are FP and TN which are the customers who actually leave. Therefore, to find the smallest FP and largest TN, Naive Bayes is the best method to use for prediction in real life.
There are several limitations in this analysis. There could be some other factors or variable that is not in this dataset. The accuracy still has a lot of space to improve by using different methods or parameters. The size of the data also could be a reason to influence accuracy. Providing more related attribution with more datasets can improve the accuracy of the prediction.
5. Conclusion
This paper aims to find the most appropriate method and parameter to create the churn prediction. To achieve this objective, this work has implemented and analyzed three classification models, including Naive Bayes, Random Forest, and Decision Tree. The best method is Naive Bayes since it has the lowest FP and the highest TN. Because of the limited datasets, parameters, and methods used in this paper, there still exists a large amount of space to improve the accuracy. The parameter “Max Depth” is not significant in the Random Forest and Decision Tree, but the tuning of the "N Estimators" and "Max Features" parameters can significantly enhance the recall, accuracy, and precision of the model. In conclusion, Random Forest provides the most accurate precision and accuracy, and Decision Tree provides the most accurate recall, but Naive Bayes is the most appropriate method in real-life cases.