


1. Introduction
With the rapid development of high technology in recent decades, shopping online has become the mainstream avenue for shopping. Compared with other shopping methods, people enjoy online shopping because of its convenience and high information transparency. However, before online shopping, the most common sources of information about a company's goods or services are typically portrayed through advertising. Due to limited resources, people often purchase products or services they end up unsatisfied with. Due to today's abundance of online reviews, consumers can attain another dimension previously unavailable pre-internet, quick and easy access to many consumers' opinions about various products and reviews. Therefore, people can make better choices so that the products they get are less likely to be unsatisfying.
The purpose of this article is to analyze online reviews from the perspective of sentiments. Since Amazon is one of the biggest shopping websites worldwide, it represents our study more. Thus, more specifically, we will mainly focus on Amazon reviews. By applying sentiment analysis, we label the Amazon reviews in the dataset found by three dimensions-Positive, Negative and Neutral. Through these labels, we will see how people think about the products. Random forest, Naive Bayes, and SVM are the three models we will use in this sentiment analysis. By comparing the performances of these three models, we aim to choose the best one or use them as ensembles so that we will get a more accurate sentiment analysis for the reviews on Amazon.
2. Literature Review
Nowadays, people already use many methods to analyze and compare online customer reviews through textual data. Askalidis and Malthouse studied the impact of reviews on the purchase of other hesitating customers. They have found that customers will treat these reviews very importantly and see them as a signal [1]. The volume of reviews can have positive effects by increasingdhbgrb the product's credibility and demonstrating its popularity.
Devika et al. summarized different approaches to analyzing sentiment, which include Machine Learning and Support [2]. Vector Machine, N-gram Sentiment Analysis, Naïve Bayes Method, Maximum Entropy Classifier, K-NN, Weighted K-NN, Multilingual Sentiment Analysis, Feature Driven Sentiment Analysis, Rule-Based Approach, Lexical based approach. Hu and Liu demonstrated summarization in two main steps: feature extraction and opinion orientation identification [3]. They focused on the nouns and noun phrases and used Part-of Speech Tagging from natural language processing. They use an association rule mining approach (Agrawal and Srikant) to find all frequent item sets [4].
Tan et al. first summarized the data of the rating system (1-5) on Amazon and then tried two types of features: building a dictionary and transforming each review into a vector, where each value represents how many times the word shows up [5]. They have used traditional machine learning algorithms including Naive Bayes analysis, Support Vector Machines, the K-Nearest neighbor method, and deep neural networks such as Recurrent Neural Networks (RNN). Rain used Probabilistic Machine Learning to analyze the books on Amazon, which usually have many reviews among other products [6]. The methodology involved feature extraction by comparing the most frequent words with the list of words in the reviews and then generating a dictionary to form True and False. Bhatt et al. used sentiment polarity analysis, measuring text as +1 for positive and -1 for negative sentiment, which proved very effective [7]. Mouthami et al. also used sentiment polarity by applying fuzzy set theory to sentiment classification [8]. Thet et al. (2010) did sentiment analysis on movie reviews using more complex methods due to the complexity and variation of movie reviews, such as creating a set of Domain-specific lexicons [9]. Yang et al. combined the advantages of sentiment lexicon, CNN model, GRU model, and attention mechanism to propose the SLCABG model [10]. Gräbner et al. also used the lexicon to analyze the sentiments and do the classification [11]. Baid et al. have combined the Naive Bayes, K-Nearest Neighbor, and Random Forest to analyze sentiments [12]. Ruder et al.used hierarchical models and Long Short-Term Memory (LSTM) [13] (Hochreitersn and Schmidhuber), which adds input, output, and forget gates to a recurrent cell, which allow it to model long-range dependencies that are essential for capturing sentiment [14]. Haque et al. used methods like Bag of Words and TF-IDF and different machine learning algorithms, and the Linear support Vector machine has the highest accuracy [15].
In machine learning, M. I. Jordan and T. M. Mitchell explained the trends and prospects of machine learning [16]. It has proliferated in the past two decades, and the algorithms have been used across several fields like computer science, statistics, and other disciplines concerned with automatic improvement. On the other hand, Shinde and Dr.Shah reviewed the deep learning applications of machine learning. There are Computer Vision, Prediction, Semantic analysis, Natural Language Processing, and Information Retrieval [17]. Finally, Nasteski gave us an overview of machine learning's algorithms and methods, which include Linear regression, Naive Bayes, and Logistic Regression [18].
3. Data
Our data comes from the essay “critical assessment - Amazon reviews on kindle” from Kaggle. This data was taken from Amazon's website in 2018. It has been browsed and cited many times, so this data is selected because of its strong representativeness and reference significance. Among them, there are mainly 21 parameters such as ID, brand, date, rating, text, and many other important user purchase information parameters. This project aims to explore the depth of consumer review sentiment, so we chose to analyze its rating and texts. For instance, if words such as "excellent," "happy," and "satisfied" appear in the evaluation, it is highly likely that customers are satisfied with the product and give a positive review. On the other hand, if words such as "bad" and "not" appear in the evaluation, then it seems that customers do not like the product, so that they may give a negative review.
Table 1: Amounts of each score in reviews (Data retrieved from https://www.kaggle.com/code/adityapatil673/critical-assessment-amazon-reviews-on-kindle/data rating )distribution
5.0 | 23775 |
4.0 | 8541 |
3.0 | 1499 |
2.0 | 402 |
1.0 | 410 |
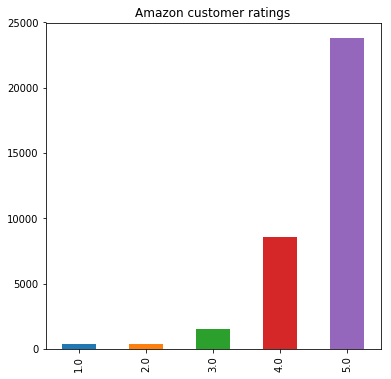
Figure 1: Amazon customer ratings
In figure 1, we can see that most consumers give 4 or 5 points of evaluation, accounting for more than 90% of the total. There are also neutral raters who give 3 points, and the least negative rating is 1 or 2 points, about 800 people. Because a large part of the data is concentrated in the high-scoring area, data preprocessing or random sampling may cause sample imbalance. This may lead to biased results due to data disaggregation, but this cannot be avoided.
4. Methodology
Figure 2 describes the methods and processes used in this project. The first part is sentiment tagging of the comments extracted from the data. They are nouns, verbs, and adjectives mainly. After preprocessing the labeled words, the data is transformed into a form that the model can manipulate. Then, run the data in 3 models(Random forest, Naive Bayes, and SVM) for model performance comparison. Next, from the services and goods provided by sellers on the Amazon website through text, we conduct research and analysis. In our methods, we formulate labeling rules by modifying the parameters in the function and analyze the features using a list of words with sentiment values. Finally, we compare different results graphically and conclude to get a complete picture of the user's emotional profile.
Figure 2: Methods of the project
4.1. Sentiment Tagging
We extract the data carefully because the minor necessary data is extracted for processing. So, we only extract two items: reviews. Rating and reviews. Text.
4.2. Data Pre-Processing
In this section, we mainly do four steps in preprocessing.
The first step is to reclassify the scores from 1-5 in the rating from Amazon reviews. Then, to do the sentiment analysis, we classify 1-2 as unfavorable, score three as neutral, and 4-5 as positive.
The second step is eliminating the meaningless single letters or cluttered symbols in the data, which is necessary for further steps. We usually use regex to solve this kind of problem in this part.
The third step is to use the method of stopwords to remove meaningless sentence structure connecting subwords such as "is," "a," " the," etc......…
The fourth step is to remove the tense of the content word and convert it to the base word. Then we use a package named “PorterStemmer" in Python to achieve our goal. Stemming reduces the number of features in the model. For example, the words fishing, and fished stem from the word fish. Stemming replaced three words with one word by removing affixes to arrive at the stem word. In this way, it can increase the speed and accuracy of modeling.
5. Data transformation
In this part, we mainly use two methods: CountVectorizer and TF-IDF Vector for data standardization. We trained with token counts and TF-IDF features separately.
CountVectorizer is a standard method for text feature extraction and numerical calculation. For each training text, CountVectorizer converts the words in the text into a word frequency matrix, which calculates the number of occurrences of each word through the fit_transform function.
The method of TF-IDF Vector transforming data is to improve the IDF value of the term on the method of CountVectorizer, that is, considering the distribution of the term among the documents. The IDF value is related to the number of texts in the training set and the number of texts containing terms.
6. Modeling
We use RandomForest, Naive Bayes, and support vector machine (SVM) in this research. Because researchers commonly use these three.
Random Forest is a classifier that consists of multiple decision trees, and the output class is determined by the population of individual trees that output the class. Leo Breiman and Adele Cutler developed an algorithm to infer random forests.
Naive Bayes is one of the most widely used classification algorithms. It is a classifier method based on the Bayesian definition and the assumption of feature condition independence. It has a solid mathematical foundation and stable classification efficiency。
SVM is a generalized linear classifier that performs binary classification of data according to supervised learning, and its decision boundary is the maximum screenwriting hyperplane that solves the learning samples.
After doing three modelings, we used a package named GridsearchCV to choose the best Machine learning model. GridsearchCV is divided into two parts, grid search, and cross-validation. After adjusting the parameters within the specified parameter range, we use it to train the learner and find the parameters with the highest accuracy on the validation set.
We used 67% of the data as the training set and the remaining 33% as the test set (holdout). Accuracy is also an important metric for evaluating classifiers. However, because the samples with positive emotions in the sample data are highly weighted, and the characteristics of accuracy failure are apparent, it is not adopted. Finally, we measure the best model using three indicators (precision, recall, F-1). Precision refers to the data ratio that matches the test set's correct result. In contrast, recall refers to the ratio of the data that has been judged correct by the model in the test set, and the ratio conforms to the correct result. F-1 is the harmonic mean of the previous two metrics.
Then we can do further analysis and get a conclusion.
7. Results
With the models introduced in the methodology part, the significant metrics to evaluate the classification performance are precision, recall, and F-1 scores. To compare the performance among the three models, the models are trained with token counts and TF-IDF features separately. Furthermore, a range of the number of features is applied to the model to examine the influence of the number of features on training. The vocabulary was built across the corpus, and the term frequency sorted the features. There are around 15000 unique tokens. The top 8000 features are chosen to be the maximum for testing. The training features begin from 0 to 8000 and the step size is set to 20. The numeric vectors take around 20GB in RAM, which is the standard limit for most computers.
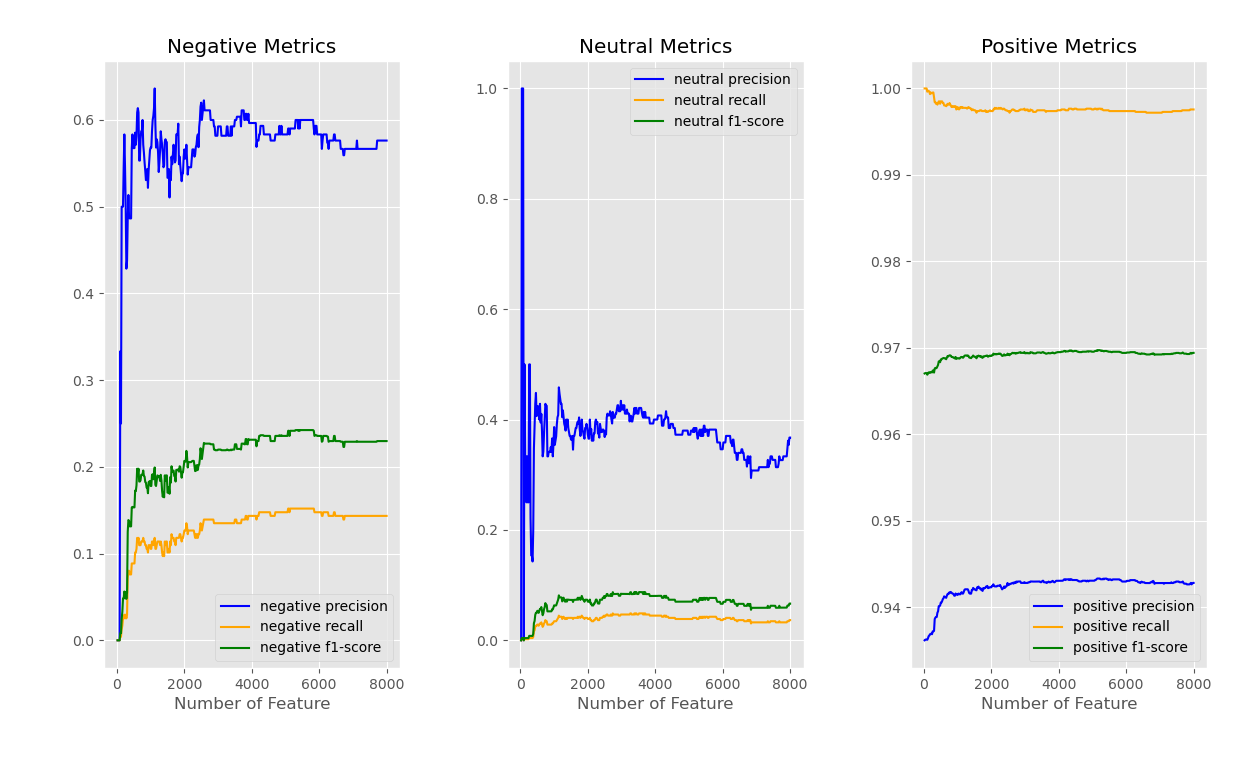
Figure 3: Results of Linear SVM with count token features
Figure 3 shows the results of the linear SVM classifier trained with token counts data among three labels: Negative, Neutral, and Positive. The model predicts positive labeled data well due to high precision, recall, and f1-score. In addition, the metrics do not have an excessive fluctuation as the number of features increases. As for negative, the precision becomes steady between 0.5 and 0.6 after the features reach 2000. The recall and f-1 scores have similar progress with incrementing the number of features. However, both attain a lower figure than the precision, which means the model is not as sensitive to harmful data as positive data. The last label, neutral, has the worst performance. The recall and f-1 scores are nearly zero, meaning the model can not identify this data category from the dataset.
The tf-idf features do not sufficiently extract information from text, as seen in figure 4. Positive data is still appropriately and effectively identified. The linear model, however, barely identifies the negative and neutral data. There is a sharp peak in negative precision. The reason is that some tokens may have a significant effect on models. The information from the negative and neutral reviews was primarily lost in the tf-idf representation.
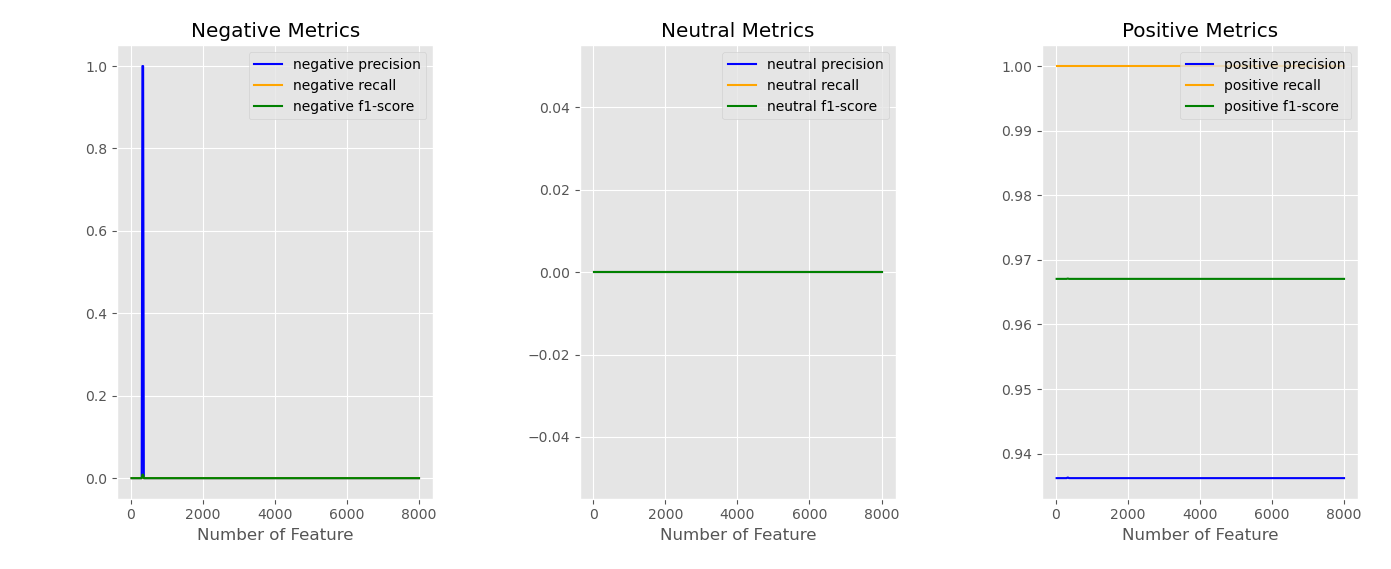
Figure 4: Results of Linear SVM with TF-IDF features
As discussed above, the token count representation has a better performance during the testing stage. The following pictures can also prove this.
Figure 5 shows the metrics of the Random Forest Classifier using token count representation. The random forest is not suitable for detecting negative and neutral reviews. The same results were attained by the model using tf-idf representation. Overall, the random forest classifiers are likely overfitting to the positive data.
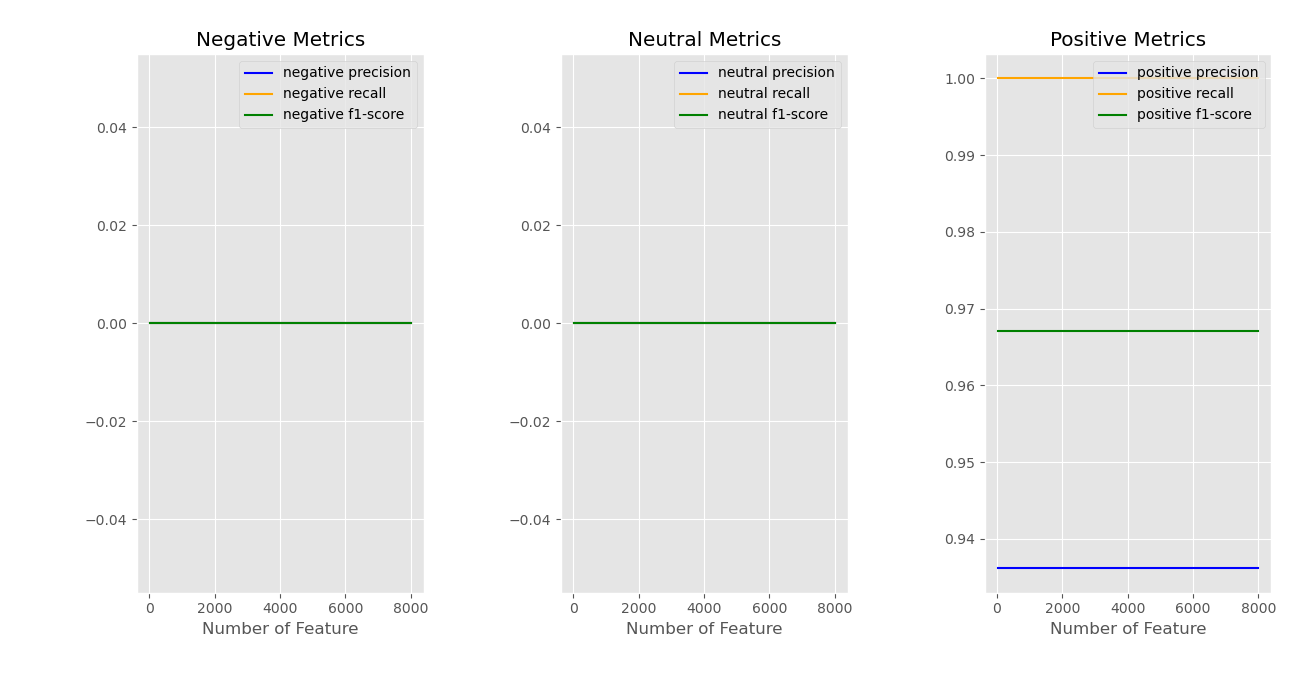
Figure 5: Results of Random Forest with TF-IDF features
Figure 6 shows the results of Naive Bayes using token count representation displayed among three labels. At first, the model can identify the positive data very well because the more significant part of the testing data is labeled as positive. As the number of features increases, the figure of negative and neutral begins to increase, which means the model learns the information of the two types of reviews. In the plot of positive metrics, recall and f1-score have a drop with the increment of the number of features. The other two figures show an escalating trend with more features extracted from text. Figure 7 still illustrates bad results among all features. Some particular tokens may help the model identify the negative and neutral reviews. But the recall and f-1 scores indicate the TF-IDF features are not suitable for the Naive Bayes Classifier.
In conclusion, when compared to linear SVM and random forest, the Naive Bayes method with token count representation yields the best results. The testing outcomes of the three models further demonstrate that the tf-idf format is unsuitable for training models. The tf-idf method primarily depends on the quality of the corpus. With this particular corpus and an unbalanced dataset, it cannot efficiently extract information. The linear SVM makes accurate predictions based on positive data, but it lacks the ability of the Naive Bayes model to identify negative and neutral data. Naive Bayes may be able to split the reviews into the proper labels with such unbalanced data.
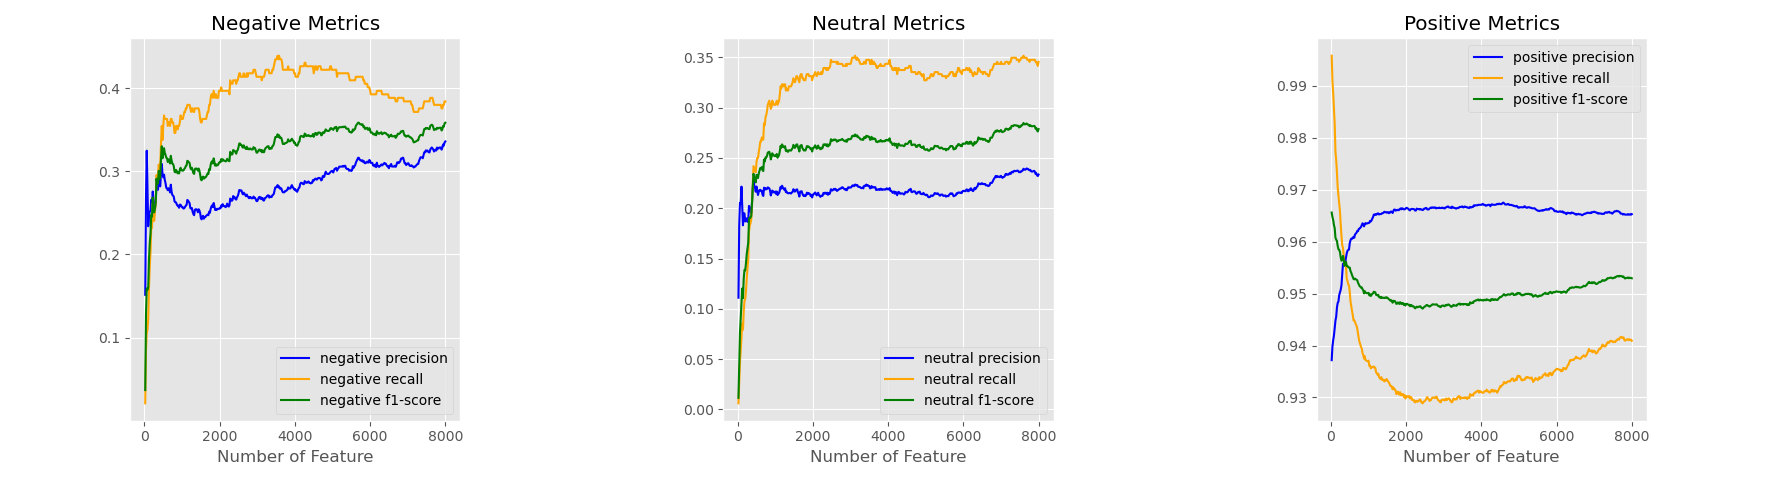
Figure 6: Results of Naive Bayes with Count Token features
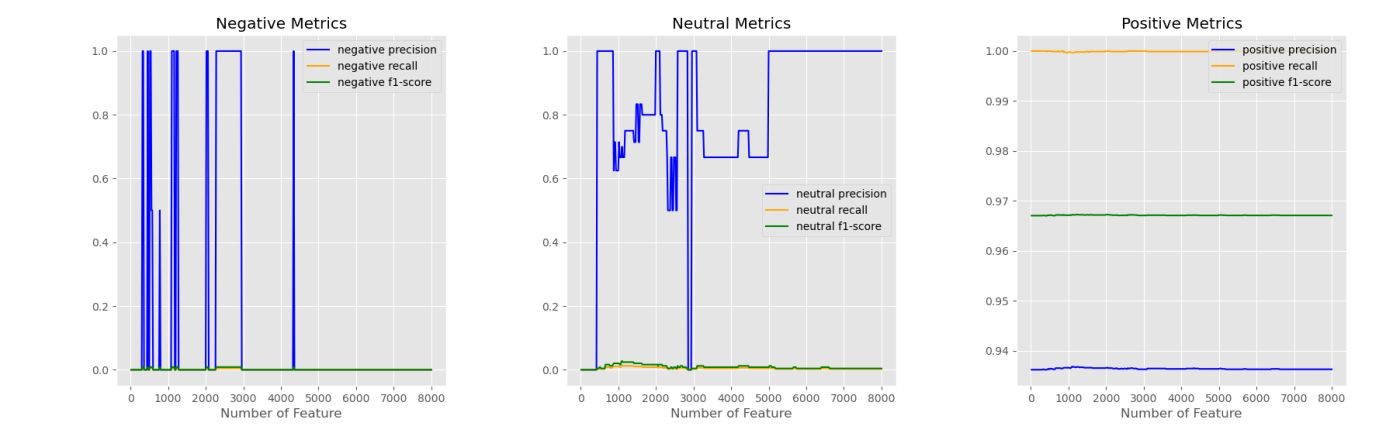
Figure 7: Results of Naive Bayes with TF-IDF features
8. Conclusion
Three models do not successfully deal with the multi-classification in this project. The big challenge is that the dataset is significantly unbalanced. The models are trained with a new strategy to solve it by setting the class weights. And the reviews contain several topics, which means that typical words of one topic may influence the sentiment classification of other topics. In later works, the best way is to separate the reviews into several groups among topics in the preprocessing step.
This project intends to find the best appropriate machine learning model for sentiment analysis of amazon reviews. Two data extraction techniques, token count representation and TF-IDF representation are applied to the dataset. The results of TF-IDF with three classification models are not ideal. Large sentiment information is lost in the data transformation stage. Random forest algorithms may not be suitable for unbalanced datasets according to zero precision, recall, and f-1 score for negative and neutral reviews. By comparing the metrics of the three models, Naive Bayes can identify the most positive reviews and stay sensitive to negative and neutral reviews.