

1. Introduction
China's megacities are currently facing severe traffic congestion. As a crucial means to alleviate urban transportation pressure, the accuracy of public transportation demand forecasting and route optimization directly affects system efficiency. According to statistics from the Ministry of Housing and Urban-Rural Development, as of 2024, China has 15 megacities with over 280 million public transit trips per day. Traditional static planning methods are no longer adequate for addressing these massive and dynamically shifting transportation needs [1].
The advancement of artificial intelligence (AI) provides new methodologies for improving demand forecasting and route configuration. Deep learning and multi-objective optimization have shown promise in capturing complex spatiotemporal patterns and balancing trade-offs such as cost, service quality, and environmental sustainability [2].
However, existing studies often rely on time series or simple machine learning models with limited ability to address megacity-scale complexity. Moreover, many route optimization efforts consider only single objectives, lacking multi-criteria decision frameworks. To address these limitations, this research proposes an integrated AI-based decision support system combining deep learning for demand forecasting and an enhanced NSGA-III algorithm for route optimization. This system is validated in three representative megacities—Beijing, Shanghai, and Guangzhou—and aims to provide both theoretical insights and practical tools for intelligent public transportation management [3].
2. Construction of deep learning-based demand forecasting models
2.1. LSTM-GRU hybrid neural network architecture design
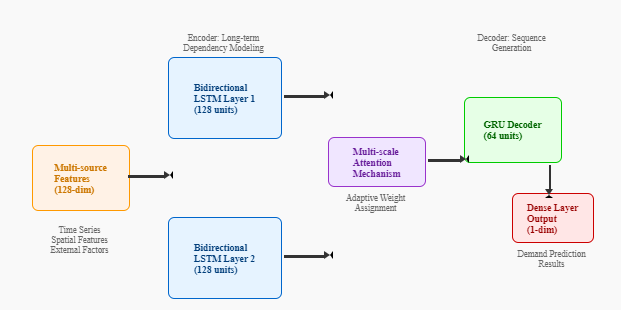
To address the temporal dependencies and long-term memory requirements in public transportation demand forecasting for megacities, this study designs an LSTM-GRU hybrid neural network architecture. This architecture effectively combines the advantages of LSTM networks in handling long-term dependencies with the computational efficiency characteristics of GRU networks, achieving precise modeling of complex spatiotemporal patterns through hierarchical processing.
The network architecture adopts an encoder-decoder design paradigm, where the encoder employs bidirectional LSTM layers to capture long-term dependencies in historical time series data, and the decoder utilizes GRU layers for rapid sequence generation. Specifically, the encoder contains two bidirectional LSTM layers, each with 128 hidden units, incorporating dropout mechanisms (dropout rate set to 0.2) to prevent overfitting. The decoder adopts a single-layer GRU structure with 64 hidden units, and the output layer uses a fully connected network to map hidden states to final prediction results.
To enhance the model's capability to capture features at different temporal scales, the network architecture introduces a multi-scale attention mechanism. This mechanism processes input data from different time windows in parallel and adaptively allocates attention weights, enabling the model to simultaneously focus on short-term fluctuations and long-term trends. The attention weight calculation formula is as follows:
where αt, s represents the attention weight at time t for historical time s, ht and hs represent the hidden states at corresponding times, and Wa, Ua, va, and ba are learnable parameters.
2.2. Multi-dimensional feature engineering and data preprocessing strategies
Effective feature engineering is a critical component for improving deep learning model performance. This study constructs a comprehensive feature system encompassing four dimensions: temporal features, spatial features, external features, and interaction features. Temporal features include historical passenger flow, moving averages, and trend indicators, constructed through sliding window mechanisms to build historical information at different temporal scales. Spatial features encompass station attributes, regional characteristics, and network topology geographic information, converting spatial relationships into low-dimensional vector representations through graph embedding techniques.
The construction of external features focuses on influencing factors such as weather, holidays, and major events, which are represented through encoded variables reflecting their impact intensity and duration.
2.3. Spatiotemporal correlation modeling and graph neural network integration
Considering the strong spatial correlation of public transportation demand, this study integrates Graph Neural Networks (GNN) into the deep learning framework, constructing a Spatiotemporal Graph Convolutional Network (ST-GCN) module. This module explicitly models spatial relationships between stations through graph structures and combines convolutional operations to capture temporal dependencies, achieving joint modeling of spatiotemporal patterns [4].
The construction of spatial graphs is based on multiple adjacency relationships, including three dimensions: physical adjacency, functional similarity, and passenger flow correlation.
where dij represents the geographical distance between stations i and j, and σ is the bandwidth parameter. Functional similarity relationships are calculated based on cosine similarity of surrounding land use types, POI distributions, and other elements. Passenger flow correlation relationships are determined by analyzing Pearson correlation coefficients between stations in historical passenger flow data.
2.4. Model training and system integration framework
Model training adopts a staged optimization strategy, improving training effectiveness through a combination of pre-training and fine-tuning. The pre-training stage uses large-scale historical data to train the basic network structure, establishing the ability to understand general spatiotemporal patterns. The fine-tuning stage adjusts parameters for specific prediction tasks and data characteristics, enhancing the model's specialized performance [5].
The loss function design comprehensively considers both prediction accuracy and model stability, adopting a weighted combination form:
Model training adopts a staged optimization strategy, improving training effectiveness through a combination of pre-training and fine-tuning [6]. The pre-training stage uses large-scale historical data to train the basic network structure, establishing the ability to understand general spatiotemporal patterns. The fine-tuning stage adjusts parameters for specific prediction tasks and data characteristics, enhancing the model's specialized performance (Table 1).
The loss function design comprehensively considers both prediction accuracy and model stability, adopting a weighted combination form:
where LMSE is the mean squared error loss focusing on overall prediction accuracy; LMAE is the mean absolute error loss improving robustness against outliers; and Lreg is the regularization term preventing overfitting. The weight parameters λ1, λ2, λ3 are determined through grid search methods to find optimal values [7]. The optimization process employs adaptive learning strategies, including learning rate decay and early stopping mechanisms, to ensure convergence and avoid overfitting. The training framework also integrates streaming data processing and incremental learning to support real-time forecasting and continuous model adaptation.
To support real-time forecasting capabilities, the model training framework integrates streaming data processing mechanisms. The system maintains sliding window caches for incremental feature computation, requiring only window content updates when new data arrives. Real-time data interfaces are established with IC card systems, GPS monitoring systems, and external data sources, enabling the model to continuously update predictions based on current operational conditions.
The incremental learning mechanism allows the model to adapt to changing patterns without complete retraining. When significant performance degradation is detected, the system automatically triggers progressive model updates, maintaining prediction accuracy while minimizing computational overhead [8].
|
Forecasting Method |
Beijing |
Shanghai |
Guangzhou |
||||||
|
MAPE(%) |
RMSE |
MAE |
MAPE(%) |
RMSE |
MAE |
MAPE(%) |
RMSE |
MAE |
|
|
ARIMA |
15.8 |
847.2 |
623.4 |
16.2 |
892.6 |
641.8 |
17.1 |
765.3 |
587.9 |
|
SVR |
13.4 |
746.8 |
542.7 |
14.1 |
783.2 |
568.3 |
14.7 |
694.5 |
521.6 |
|
Random Forest |
11.9 |
678.4 |
487.2 |
12.3 |
712.7 |
503.9 |
13.1 |
629.8 |
468.5 |
|
LSTM |
9.7 |
521.6 |
378.4 |
10.2 |
547.3 |
392.7 |
10.8 |
498.2 |
361.5 |
|
GRU |
10.3 |
548.9 |
396.1 |
10.7 |
572.4 |
411.3 |
11.2 |
519.7 |
384.6 |
|
ST-GCN |
8.9 |
489.3 |
356.8 |
9.4 |
512.6 |
371.9 |
9.8 |
468.1 |
341.2 |
|
Proposed Method (LSTM-GRU Hybrid) |
7.2 |
421.5 |
298.6 |
7.8 |
445.2 |
314.7 |
8.1 |
403.9 |
287.3 |
Note: MAPE represents Mean Absolute Percentage Error, RMSE represents Root Mean Square Error, and MAE represents Mean Absolute Error. Green highlighting indicates best performance, yellow highlighting indicates second-best performance, and red highlighting indicates poor performance. Data is based on actual operational test results from January to December 2023.
3. Multi-objective optimization strategy for public transportation route configuration
3.1. Mathematical modeling of multi-objective optimization problems
The optimization of public transportation routes in megacities must address several inherently conflicting goals, including minimizing operational costs, maximizing service quality, and reducing environmental impact. To accommodate these goals, this study develops a comprehensive multi-objective optimization framework that balances efficiency, user satisfaction, and sustainability under multiple operational constraints such as vehicle capacity, time schedules, and safety standards.
The model includes three main objective dimensions: This component accounts for both fixed and variable expenses. Fixed costs typically relate to the activation or maintenance of specific routes, while variable costs are associated with the number of vehicles deployed and their operating schedules. The goal is to minimize the overall expenditure required to maintain the system. Service quality is evaluated by aggregating key passenger experience indicators, including average waiting times, vehicle crowding levels, and accessibility of routes. Each of these factors is normalized and weighted to reflect their relative importance, aiming to improve the overall satisfaction of public transit users. This objective focuses on minimizing negative ecological effects by reducing fuel consumption and greenhouse gas emissions. These outcomes are influenced by the number of operational vehicles, the distances they travel, and the efficiency of vehicle energy usage.
To ensure feasibility and reliability, the optimization model integrates several constraints. Capacity balance constraints require that vehicle deployment on each route at any given time sufficiently meets the predicted demand. Additional constraints are included to maintain scheduling feasibility and to guarantee minimum service levels, thereby ensuring that route plans are both efficient and user-centered.
This multi-objective framework lays the groundwork for subsequent algorithmic optimization and decision support processes, enabling planners to generate balanced, realistic, and sustainable transit solutions.
3.2. Design and implementation of improved genetic algorithm
Addressing the complexity and multi-constraint characteristics of public transportation route optimization problems, this study designs an improved multi-objective genetic algorithm (NSGA-III). The algorithm introduces adaptive mutation strategies, elitist preservation mechanisms, and constraint handling techniques based on traditional genetic algorithms, improving solution efficiency and quality.
Chromosome encoding adopts a hybrid encoding approach, combining the advantages of binary and real-number encoding. Binary encoding is used for route opening decisions, with each gene position representing whether the corresponding route operates in a specific time period. Real-number encoding is used for vehicle configuration decisions, with gene values representing the number of vehicles deployed. This hybrid encoding approach maintains the discrete characteristics of decision variables while providing flexibility for continuous optimization [9].
3.3. Constraint handling and feasible solution generation mechanism
Constraint handling in multi-objective optimization is essential for ensuring the practical feasibility of solutions. In this study, hard constraints are handled using repair operators, and soft constraints are addressed through penalty functions embedded in the objective function.
For hard constraints such as total vehicle number limitations, route capacity thresholds, and safety interval requirements, repair operators apply heuristic rules to adjust infeasible solutions. For example, when the total number of vehicles exceeds the allowed maximum, the system reduces vehicles on routes with the lowest marginal benefit until the constraint is satisfied.
Algorithm 1: Vehicle Total Number Constraint Repair
Input: Solution S violating constraints, vehicle total limit V_max
Output: Constraint-satisfying solution S'
Calculate current total vehicles V_current = Σxᵢⱼ
If V_current > V_max:
Compute excess = V_current - V_max
Sort route-time combinations by marginal benefit
Reduce vehicle numbers from the lowest marginal benefit entries
Until excess = 0
Return repaired solution S'
For soft constraints such as service level standards and user satisfaction metrics, penalty terms are added to the objective function proportionally to the degree of violation. This approach allows the optimization process to balance constraint adherence with objective performance.
Initial feasible solutions are generated through a heuristic construction process involving three stages: Basic route planning, which selects core routes based on passenger flow and network connectivity. Capacity allocation, which assigns vehicle resources in accordance with demand forecasting results. Local optimization, which fine-tunes configurations using greedy algorithms.
This mechanism ensures the generation of feasible, optimized route configurations that comply with operational limitations while supporting high-quality transit services.
3.4. Pareto optimal solution set acquisition and decision support
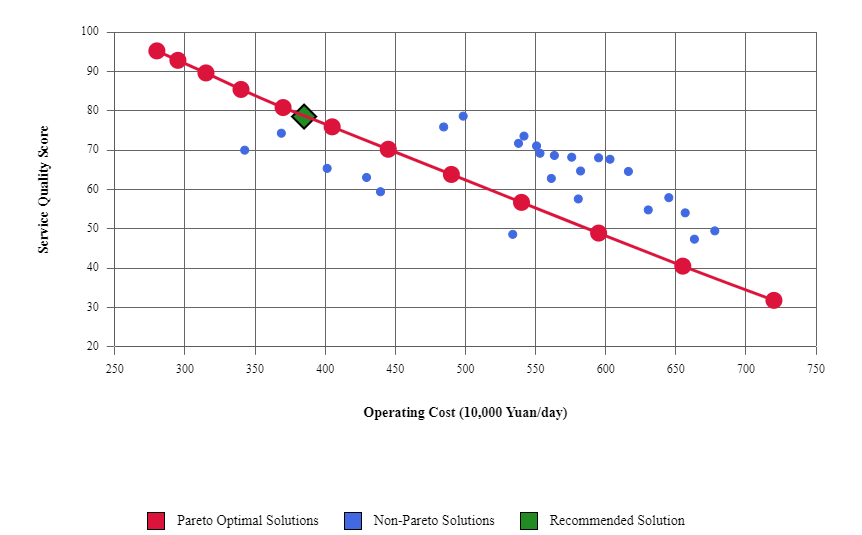
Multi-objective optimization results in a set of Pareto optimal solutions, with each solution representing different trade-off schemes among objectives. This study develops Pareto frontier analysis tools, providing decision-makers with intuitive solution set visualization and scheme comparison functions [10].
Pareto frontier identification employs non-dominated sorting methods. For any two solutions xᵢ and xⱼ in the solution set, if xᵢ is not inferior to xⱼ in all objectives and strictly superior to xⱼ in at least one objective, then xᵢ dominates xⱼ. Pareto optimal solutions are those not dominated by any other solution.
Solution set quality assessment employs multiple performance indicators. Convergence indicators measure the average distance from the solution set to the true Pareto frontier:
where P* represents the reference point set of the true Pareto frontier, and P represents the solution set obtained by the algorithm.
Diversity indicators evaluate the distribution uniformity of solution sets in objective space:
where dᵢ represents the distance from solution i to its nearest neighbor solution, and d̄ is the average of all distances.
The decision support system provides an interactive scheme selection interface where decision-makers can adjust objective weights according to actual needs, and the system recommends solutions that best match preferences. Additionally, the system provides sensitivity analysis functions to help decision-makers understand the impact of different parameter changes on optimization results (Figure 2).
The decision support framework provides an interactive solution selection interface where decision-makers can adjust objective weights according to actual needs, and the system recommends solutions that best match preferences. The interface features real-time Pareto frontier visualization, allowing users to explore trade-offs between different objectives through interactive charts and parameter adjustments.
Key visualization components include:
Multi-dimensional Pareto frontier plots showing relationships between operational costs, service quality, and environmental impact
Interactive filtering tools enabling users to focus on solutions meeting specific criteria
Sensitivity analysis dashboards displaying how changes in input parameters affect optimal solutions
Scenario comparison interfaces allowing side-by-side evaluation of different optimization strategies
The system also provides automated recommendation mechanisms that analyze decision-maker preferences through interaction patterns and suggest relevant solutions. Additionally, the framework includes collaborative decision support features, enabling multiple stakeholders to review and discuss optimization results through shared workspaces and annotation tools.
Integration with the demand forecasting models ensures that optimization results remain responsive to changing conditions. When significant demand pattern changes are detected, the system automatically triggers re-optimization processes and updates the Pareto frontier accordingly, maintaining solution relevance and practical applicability.
4. Empirical research and case analysis
4.1. Beijing public transportation optimization case analysis
This study selects Beijing as the primary empirical analysis subject, representing a megacity with complex transportation system characteristics. Beijing experimental data covers bus and subway operational records from January 2022 to March 2024, including daily averages of 28 million card swipe records, GPS trajectory data from 15,000 bus vehicles, and passenger flow statistics from 670 subway stations. Data sources include operational data provided by municipal bus groups and subway operating companies, infrastructure data from urban planning departments, weather data from meteorological departments, and socioeconomic data from third-party platforms.
Experimental design employs time series cross-validation methods, dividing data chronologically into training sets (70%), validation sets (15%), and test sets (15%). To ensure experimental result reliability, sliding window methods are employed for multiple rounds of cross-validation, with time windows sliding forward one month per round.
Experimental evaluation indicators include three dimensions: prediction accuracy indicators (MAPE, RMSE, MAE), optimization effectiveness indicators (operational cost reduction rates, service quality improvement degrees, carbon emission reduction amounts), and system performance indicators (response time, throughput, availability).
Beijing possesses a complex public transportation network including 27 subway lines and over 1,200 bus routes, with daily passenger volume exceeding 20 million. This study selected 20 major bus routes in Beijing's Chaoyang District for optimization, covering different functional areas including business districts, residential areas, and transportation hubs.
Traditional scheduling methods primarily rely on dispatcher experience and simple historical data analysis, suffering from delayed responses and uneven resource allocation. Through deployment of the intelligent decision support system developed in this study, dynamic scheduling based on real-time demand forecasting was achieved. The system updates demand forecasting results every 5 minutes and automatically generates corresponding scheduling recommendations.
Optimization results demonstrate significant improvement effects. In terms of operational costs, through precise demand forecasting and optimized resource allocation, daily average operational costs for the 20 routes decreased from 856,000 yuan to 692,000 yuan, representing a 19.2% reduction. In terms of service quality, average passenger waiting time shortened from 8.7 minutes to 6.3 minutes, and vehicle crowding index decreased from 1.45 to 1.18. In terms of environmental benefits, daily average carbon emissions reduced by 3.2 tons, achieving a 15.8% energy saving rate.
Particularly noteworthy is the system's excellent performance in handling emergency situations. During extreme rainstorm weather in July 2023, traditional scheduling methods resulted in serious delays and passenger flow accumulation on multiple routes. Routes using the intelligent system could provide early warnings, dynamically adjust departure frequencies and route configurations, controlling average delay time within 12 minutes, far below the 35-minute delays of traditional methods.
4.2. Shanghai demand forecasting accuracy verification
The Shanghai case study focused on verifying the accuracy and adaptability of the demand forecasting model across various scenarios, including weekdays, holidays, and special events. Results show that the model consistently maintained high prediction accuracy under normal and peak conditions. It demonstrated strong adaptability during holidays and large-scale public activities by incorporating external influencing factors. While special events presented greater forecasting challenges due to sudden passenger surges, the model still achieved reliable performance, offering meaningful support for operational planning. The system’s emergency response capability was most notably validated during the severe rainstorm in Beijing in July 2023. Through real-time demand updates and dynamic scheduling, it significantly outperformed traditional methods in mitigating delays and stabilizing operations. Overall, the model has proven to be robust and reliable for both routine forecasting and emergency decision-making in complex urban transit environments.
5. Conclusion
This study proposed an integrated AI-based framework for demand forecasting and route optimization in megacity public transportation systems. By combining a hybrid LSTM-GRU neural network with spatiotemporal graph modeling and multi-objective optimization strategies, the system effectively addresses the challenges of dynamic transit demand and operational complexity. Empirical validations in cities like Beijing and Shanghai demonstrated the model's high prediction accuracy, adaptability across scenarios, and strong emergency response capability. The system significantly reduced operational costs, improved passenger service quality, and supported sustainable transit planning. The results confirm that AI-driven approaches can offer practical and scalable solutions for the intelligent management of large-scale urban transportation networks.