


1. Introduction
The automotive industry is positioned at the intersection between conventional internal combustion engine vehicles and newly launched electric vehicles (EVs). Whether an emerging brand or a leading traditional manufacturer, all are putting effort into the electrification transition and introducing many fresh models. Some EV models have achieved a significant level of popularity. A typical example is the Tesla Model Y, a 4-year-old product since its launch, which surpassed the representative of petrol-powered top sales, Toyota Corolla and Toyota RAV4, and became the best-selling vehicle in the first quarter of 2023 in 152 nations [1,2]. In addition, a traditional manufacturer, BMW Group, reports that their EV sales were strong in 2023, with more than 330,000 vehicles sold, with a growth of 92.2% [3]. On a global scale, the development of EV sales had been predicted to continue in 2024, which is inferred to be more than 20% of vehicle sales [4]. Several nations have taken the lead in promoting the expansion of electric vehicles. In 2023, approximately 90% of car sales in Norway are categorised as EVs, which reflects the strength and vitality of EVs to the rapid growth in their market share [5]. This phenomenon is driven by a variety of factors. A combination of various factors drives this phenomenon. A significant one is mitigating climate change. Abandoning the usage of internal combustion engines is an effective way to reduce our dependency on fossil fuels, thus cutting greenhouse gas emissions and achieving the scheduled clean energy transition targets.
Motivated by the strong trend of EV transition in the automotive industry, understanding EV development's latest focuses, priorities, and structural relationships is significant in providing researchers with a cognitive framework for the industry's future directions, guidance on development, and market forecasting. Since the EV industry’s research outcomes in academic literature represent cutting-edge progress in all relevant perspectives, analysis via social network analysis containing nodes and edges is ideal [6]. This study aims to investigate the past twenty-five years of EV industry development by using visualised social networks to analyse the relevant academic literature. It is beneficial for both the future innovations of the transportation industry and solutions for crises such as global warming.
2. Literature Review
The electric vehicle (EV) industry is essential to the global landscape. It has a long history, dating back 192 years to the invention of the first electric-powered vehicle [7]. Its recent boost in development is due to several categorised reasons: the increasing risks of climate change, the long-term planning of energy structures in different countries, and revolutionary automotive technical innovations. Climate change is considerably alarming. The World Health Organization states that climate change caused by emissions can cause natural disasters from several perspectives, including more intense “heatwaves, wildfires, floods, tropical storms, and hurricanes,” and urgent solutions are necessary to mitigate risks that cost people’s lives [8]. To mitigate climate change, political plans for transforming into sustainable energy have been set, which accounts for approximately half of global energy consumption [9]. The expansion of EVs is an ideal solution. Its contributions to reducing greenhouse gas emissions and consumptions of fossil fuels, optimising infrastructure constructions for expanding renewable energy generation, and avoiding the weaknesses of fossil-fuel-powered vehicles to improve the overall product performance are advantages to address multi-point crises.
On the other hand, there are constraints from different perspectives for its growth. In chemistry, lithium-ion batteries for EVs have limited energy density, at around 265–280 Wh/kg [10], which limits the mileage extracted from a single charge and is sometimes insufficient for long-distance travel. As a result, the distribution of charging stations determines the convenience of using EVs. A report by [11] states a vast difference in the density of EV charging stations between urban and rural districts in the United States, revealing room for improvement in infrastructure construction. The authors also emphasise that those people who reside closer to a public charging station are more welcoming to EVs. Additionally, user experience factors such as waiting for vehicle charging are obstacles to making EVs more popular.
From the early experimental prototypes to well-established products such as the Tesla Model 3, technological advancements are determinative in addressing the climate change crisis, diminishing dependence on fossil fuels, and enhancing employment within relevant supply chains. The industry's growth has been accompanied by the encouragement of policies from the government and an increasing acceptance from the public. Social network analysis is a reliable analytical platform that applies to the EV industrial field, defined as “visualising and analysing relationships and connections between entities or individuals within a network” [12]. This methodology is especially effective for evaluating the state-of-the-art EV industry because it allows us to clarify research trends through literature keyword network analysis, which reveals correlations between technological development priorities, trends, popularities, and supply chain structures. Such insights are valuable for stakeholders in the industry and researchers.
Social network analysis is particularly good at identifying research and market trends. Previous studies of the EV industry have shown the effects of different approaches. For instance, regarding electric vehicle patents, [13] analysed the technical patents of EVs in China. The authors found that the research focused on batteries, electronic control, and motors while also revealing the key trends of future research and development of EVs [13]. Simultaneously, social network analysis plays a comprehensive role in influencing EV purchase decisions across various markets. A researcher uses social network analysis to evaluate how EV users interact to provide a strong foundation for understanding perceptions and preferences regarding EVs [14]. Moreover, social network analysis also contributes to policy and industrial planning, serving as a crucial tool for comprehending the growth and potential obstacles within the EV industry. A study by [15] highlights the importance of social network analysis in evaluating EV policies, mainly how government policies affect the popularity of EVs through the network structure. The results show that subsidy policies are particularly effective in manufacturer networks, highlighting the practical value of social network analysis in EV policy evaluation.
This study, founded on the results of the literature's keyword social network analysis, offers a forecast for the future development direction of the EV industry, encompassing technological research and development as well as market response. It constructs the basis and guidance for judging the future development of the EV industry.
3. Methodology
This section focuses on the methodology for conducting a comprehensive social network analysis of the EV industry’s academic research using the VOSviewer and Gephi visualisation software.
The key is constructing a structural network to identify significant keywords from articles under different perspectives representing the industry's cutting-edge trends. The first step is to extract the 49110 final English publication datasets related to the EV industry, separated by three sets of keywords, from the Scopus database. The publication period covers the past twenty-five years, between 1999 and 2024, ensuring the selected articles are broad and current. The search keywords and filters are carefully considered to ensure the relevance and significance of the articles about EV development and industry. The next step is data preprocessing, which manually removes irrelevant or marginal keywords to make the datasets more concise and accurate. The deleted keywords are “location,” “real time,” “drops,” “antenna,” “errors,” “road,” “surveys” and “brain”. Cleaned data has been fed into VOSviewer to construct a co-occurrence visualised network. The threshold has been set to five, and the number of keywords to be selected is 1000, which cuts the less significant relations between keywords and emphasises the more critical connections left. Several settings have been adjusted to optimise the visualisation effect. The node scale is 1.18, the variation in label size is 0.54, and the variation in line size is 0.71. Analysis results are based on identifying central keywords and assessing their positions within the network through parameters.
Table 1: The search standard is listed.
Search Keywords | Number of Articles |
electric AND vehicle | 20000 |
electric AND car | 9110 |
battery AND electric AND vehicle | 20000 |
Table 1: The keywords searched and the number of articles from the Scopus database corresponding. 20000 is the maximum number of articles a single set of keywords can extract.
Finally, the network is exported into Gephi to calculate the parameters. The layout is set as ForceAtlas2. Calculated parameters, including everything from the “Network Overview,” “Community Detection,” “Node Overview,” and “Edge Overview”.
4. Results
Figures 1, 2, and 3 illustrate the same network constructed by VOSviewer in different ways. The resulting network of academic research within the EV industry using VOSviewer and Gephi provides a comprehensive overview of their keyword relationships. The VOSviewer illustrates a network with 991 nodes, 242,749 edges, and a total link strength of 1,884,874. This means that the network is dense and interconnected between the nodes of words.
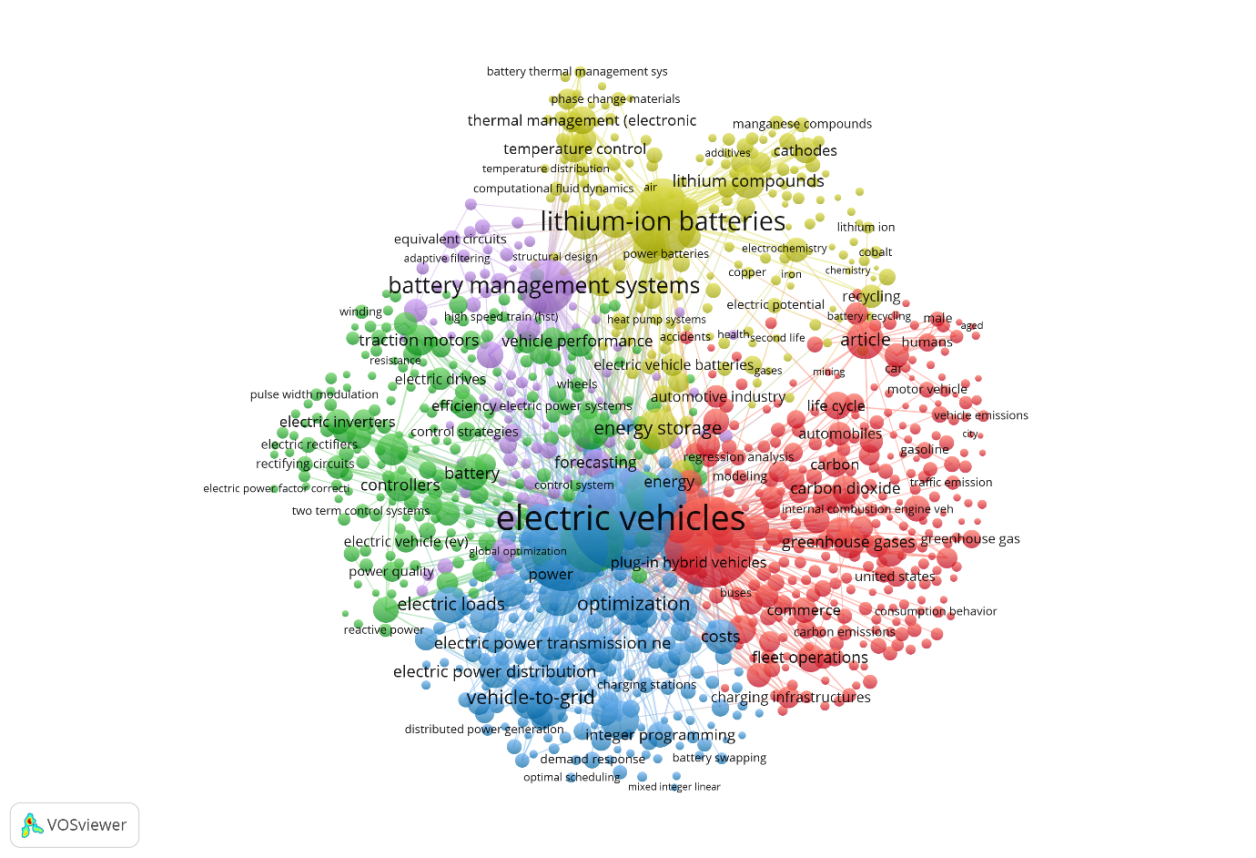
Figure 1: The network visualisation of the research keywords in the past twenty-five years. Clusters are classified into different colours.
All three figures represent a single network with identical nodes and structure, but each contains unique information. Figure 1 is the conventional view of the resulting network. The size of each keyword node is equivalent to its significance in the network. Examples of critical nodes include “electric vehicles,” “lithium-ion batteries,” and “battery management systems.” The network is divided into five interconnected groups, each represented by a unique colour. Each colour represents a broad research topic. While the nodes within a cluster are closer to each other, nodes in the central regions of the network are correlated with the ones in different clusters.
Figure 2 focuses on the overlay visualisation, which represents the time sequence. The lighter a node’s colour, the later the keyword is researched, and vice versa. Early focuses establish a foundation of concepts and technologies, such as “gasoline” and “carbon dioxide,” that prepare for later development. At the same time, the bright yellow research themes in the marginal regions, such as “electric power distribution” and “consumption behaviour,” emphasise the latest advancements and potential future directions.
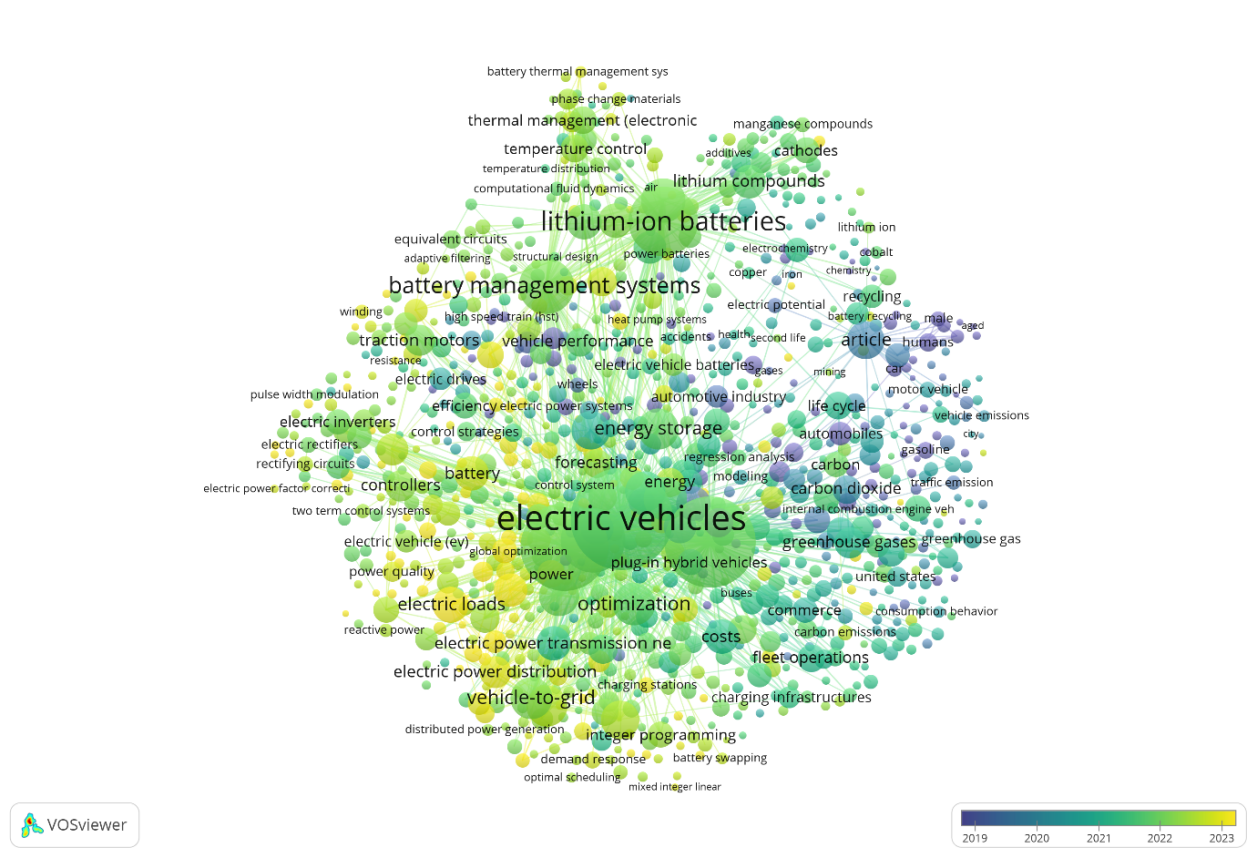
Figure 2: The overlay visualisation of the same network by VOSviewer.
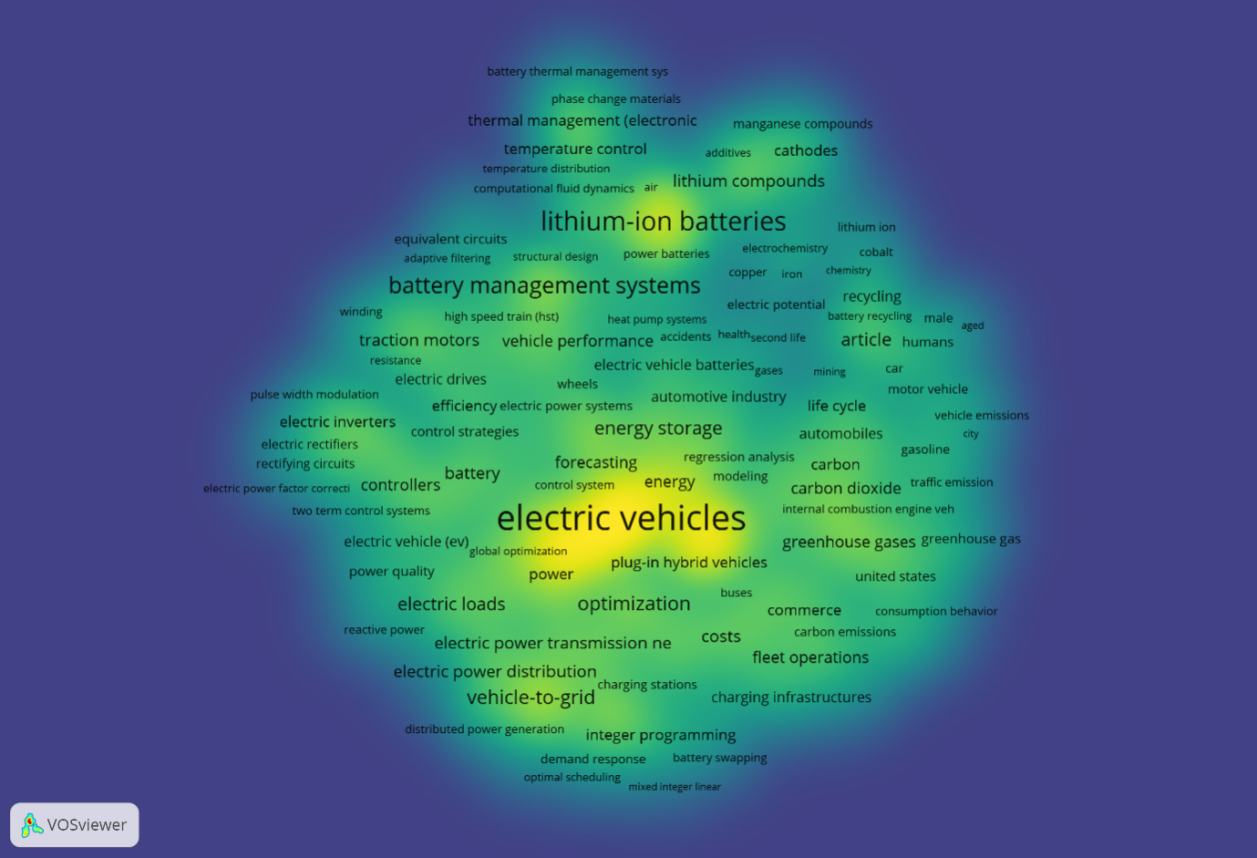
Figure 3: The density visualisation of the same network by VOSviewer.
Figure 3 presents a density network. A node with a higher density indicates a higher level of correlation among all nodes and exerts a more substantial influence in the field. Nodes in the central areas usually have higher density, presented by light yellow spots, meaning they are more powerful when connecting more nodes. However, the more advanced newer nodes have lower densities. This means they need more time to establish a strong influence with each other but are keeping enough potential to become key nodes in the future.
The output of Gephi complements the VOSviewer’s visualisation by providing statistical network calculations. Overall, a graph density of 0.495 indicates that the network of EV industry research is dense, with approximately half of the available connections between nodes being linked. This means that the research topics within the EV industry significantly overlap, and many keywords share familiar contexts. The average degree of the network of 489.9 emphasises the broad connectivity of each keyword, showing the importance of many ideas. In addition, a modularity value of 0.26 presents distinct groups within the network. Although some differences exist in research topics, relative similarities and interactions still exist between clusters. For some nodes, eigenvector centrality close to 1.0 indicates significant influence from specific keywords. Not only do they have high direct connections, but they also connect to other nodes that are welcomed.
5. Discussion
In the past twenty-five years, researchers of the EV industry have focused on five main fields: EV technologies, power management, battery technology, battery materials, and environmental protection. This shows the specialisation of that research and the interconnection between them. They are not only about EV technical development, especially related to electric power but also energy sustainability. Some keywords are positioned centrally, such as “electric vehicles,” “lithium-ion batteries,” “battery,” “battery management systems,” “vehicle to grid,” “greenhouse gases,” and “carbon dioxide.” These are the core of this research landscape. According to Figure 3, some keywords have more centrality than others, such as “battery management systems” and “energy storage,” reflecting that these areas are significant research key points and potentially continue to be the future trend. Based on the outlay network, some research areas are more conventional than others, especially those related to the sustainable environment, such as “emissions,” “alternative fuel,” and “exhaust gas”. Fields of EV innovative technologies are relatively fresher, including “electric loads,” “battery swapping,” “electric power distribution,” and “state of charges”. Core topics retain significance in the research landscape, but the new branches surrounding them provide new perspectives and results innovations. The shape and number of new focuses present the width of the EV research.
Keyword network analysis can positively affect practical applications in the EV industry, especially in technical development and market predictions. By identifying the central topics and focus, relevant firms can adapt their market strategies to match the latest research trends and consumer interests. For example, central phrases of “electric vehicles” and “lithium-ion batteries” indicate intense research and consumer interest in these fields, potentially guiding the companies to develop better EVs and lithium-ion batteries. On the other hand, marginal topics have the value of research opportunities, such as “vehicle to grid”. It presents opportunities for researchers to thoroughly explore the area in the future, which directs their work. The analysis serves as a compass for stakeholders in the industry to find a correct way in the complicated and competitive environment. They can use the analysis to locate their products, utilise collaborations, and encourage innovative development. The insights extracted will help the industry resonate with academia's cutting-edge focus.
6. Conclusion
In conclusion, this study investigates the development of the EV industry based on the visualisation of the keyword network by VOSviewer and the statistical results of Gephi over the past twenty-five years. The integrated output provides a comprehensive insight into the dynamic and interconnected academic network. It has been found that the network is significantly dense, which means research fields are closely related and collaborative with each other. This confirms the vitality and potential of this field. The eigenvector centrality reveals the structure of the field, highlighting the cohesion of specific research areas and the influential concepts that tie the broader field together. Although some new but marginal research topics show their weaknesses in establishing their influences and connection with each other, they are believed to potentially construct their power in the future. These insights can guide researchers in identifying key areas for further exploration and understanding the broader context of their work within the industry's research landscape. Future work will focus on collecting academic literature and keywords from different databases and combining them to construct a cross-database network, providing a more extensive picture of the EV industry research.