


1. Introduction
Predicting corporate default risk is central to financial supervision, investment risk management, and systemic stability. Traditional risk modeling approaches primarily rely on firm-level indicators such as profitability, leverage, and liquidity. While these methods have demonstrated utility in stable environments, they often fail to capture the complex, dynamic interdependencies that characterize modern corporate ecosystems. In reality, firms are embedded in intricate networks of economic relationships, linked by supply chains, ownership structures, and shared governance, that serve as channels for financial contagion and systemic amplification of localized shocks. Recent developments in graph-based learning, particularly graph neural networks (GNNs), offer powerful tools to model such relational dependencies. By encoding both node-level attributes and the structure of inter-firm connections, GNNs can learn latent representations that reflect not only internal financial health but also external exposures through the economic network. However, few applications of GNNs have extended into the domain of corporate credit risk, leaving a methodological gap in risk analytics that this study aims to address [1]. In this paper, we propose a GNN-based framework that integrates heterogeneous firm relationships into a predictive model for corporate defaults. Using a relational graph convolutional architecture and survival analysis head, we generate time-dependent probability estimates that outperform conventional machine learning and deep learning models. Our contributions include a detailed construction of the firm-level HIN, systematic performance evaluation through ablation tests, and validation across stress and non-stress periods [2]. This study demonstrates that incorporating inter-firm networks significantly improves the timeliness, accuracy, and interpretability of corporate default risk forecasts, contributing to a new generation of network-aware financial risk assessment tools.
2. Literature review
2.1. Financial-ratio–based default models
Traditional default prediction models rely on firm-level financial ratios like profitability, leverage, and liquidity. The Z-score model combines these into a single distress index but assumes firms operate independently [3]. This limits effectiveness during systemic stress and ignores interdependencies such as supply chains and shared governance. As a result, these models often overlook cascading failures and provide limited early warning, highlighting the need for approaches that incorporate relational and temporal dynamics [4].
2.2. Network perspectives on credit risk
Recent studies in applied economics show that inter-firm networks amplify default risks. Firms in tightly linked trade or equity networks are more prone to contagion from partner failures. For instance, a key supplier's collapse can disrupt multiple buyers. Ownership ties and shared directors also transmit shocks. Ignoring these structures leads to underestimating systemic risk. Incorporating network perspectives helps identify firms at elevated risk due to their position in the broader economic network, not just their own financials.
2.3. Graph neural networks in finance
Graph neural networks (GNNs) are effective for learning from relational data and have been applied to fraud detection and market prediction. Their message-passing mechanisms capture influence and shared attributes across entities [5]. However, few studies use GNNs for corporate credit risk, despite its reliance on interdependencies. Unlike traditional models, GNNs embed both firm-level and network-level features, revealing hidden vulnerabilities. Applying GNNs to credit risk provides a more realistic understanding of firm exposure within financial networks.
3. Experimental methods
3.1. Data acquisition and graph construction
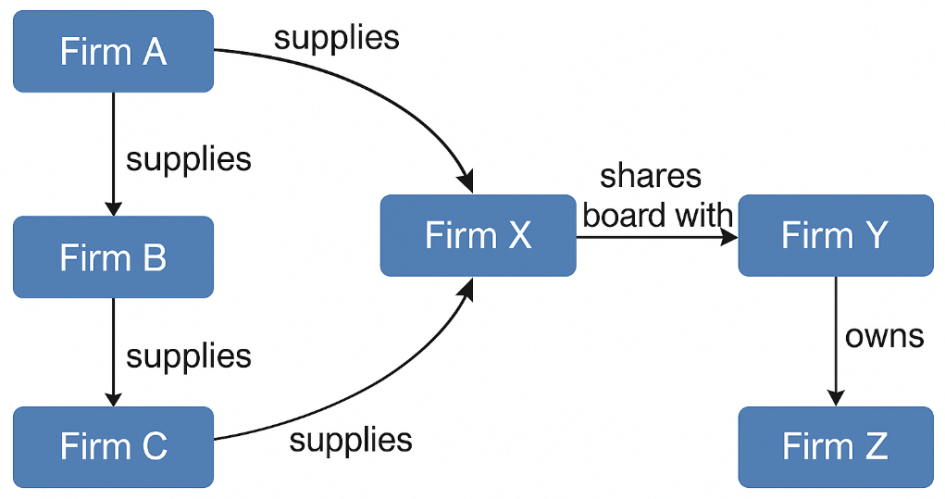
We built the model’s relational foundation using data from Compustat (financials), Thomson Reuters (ownership and board ties), and FactSet (supply chains). Firms were represented as nodes in a heterogeneous graph, with edges denoting supplier-customer links, shared directors, and ownership [6]. Data from 2014 to 2024 was aligned to ensure consistent identifiers and edge integrity. As illustrated in Figure 1, such as Firm A supplying others or Firm Y owning Firm Z—enabling the model to learn network-aware embeddings for improved default risk prediction.
3.2. GNN architecture design
We implement a three-layer Relational Graph Convolutional Network (R-GCN) to learn firm embeddings that integrate both intrinsic attributes and inter-firm relations. Each layer performs message passing conditioned on relation type, and residual connections help preserve node-specific features [7]. The resulting 128-dimensional embeddings capture both firm-level financial signals and network topology, which are subsequently fed into a survival-analysis head for time-dependent default prediction.
The forward propagation in each R-GCN layer is defined as:
where:
3.3. Evaluation metrics and baselines
We evaluated our model using metrics suited for both classification and time-to-event prediction. The Area Under the ROC Curve (AUC) measures the model’s ability to discriminate between defaulting and surviving firms, while the F1 score balances precision and recall. For temporal performance, we used Harrell’s C-index, which assesses the concordance of predicted survival times with observed defaults. As baselines, we compared our GNN against logistic regression, random forest, and LSTM-based models using the same financial variables. These non-graph models provide a benchmark for assessing the added value of network-based learning. All evaluations were conducted using a hold-out test set to ensure statistical validity [9].
4. Experimental process
4.1. Training and validation strategy
To simulate real-world forecasting conditions and avoid look-ahead bias, we employed a rolling-window strategy. The model was trained on firm data from 2014 to 2019, validated on the 2020 cohort, and tested on data from 2021 to 2024. This time-based partitioning respects the temporal order of information and mimics actual deployment scenarios. During training, we ensured that firms did not appear across multiple splits to prevent data leakage. Validation results were used to guide hyperparameter tuning and early stopping [10]. This design ensures that the model’s performance reflects its genuine ability to generalize and adapt to unseen market conditions and firm behaviors.
4.2. Hyper-parameter optimization
We used Bayesian optimization via the Optuna framework to systematically search the hyperparameter space and identify configurations that maximize predictive performance. Key parameters included learning rate, dropout rate, number of message-passing layers, and hidden embedding size [11]. The objective function was the validation C-index, which reflects the model’s ability to predict survival ordering. The search was constrained to reasonable bounds based on preliminary experiments and GNN literature. Optimal values typically included moderate dropout to mitigate overfitting and two to three convolution layers to balance expressive power and computational cost. This tuning process ensured that the final model was robust and efficient [12].
4.3. Robustness and ablation tests
To isolate the contribution of different network components, we conducted a series of ablation experiments. In each variant, we removed one type of edge—ownership, supply-chain, or board overlap—and re-evaluated model performance. The most significant drop occurred when supply-chain links were excluded, underscoring their importance in default propagation. We also tested model stability by introducing Gaussian noise to node features and replacing learned embeddings with random vectors. The performance deterioration in these tests confirmed that both the graph structure and GNN-based representation learning were essential. These robustness checks validate the integrity of the model and its reliance on real economic interdependencies.
5. Experimental results
5.1. Predictive performance comparison
Our GNN-based model achieved a mean AUC of 0.921 and a C-index of 0.887 on the test set, outperforming all baseline models by substantial margins. As shown in Table 1, traditional classifiers such as logistic regression (AUC 0.783) and random forest (AUC 0.812) lag behind, while the best non-graph deep learning baseline, the LSTM, reached only 0.850 AUC and 0.816 C-index. These results underscore the GNN’s ability to synthesize inter-firm structural data into predictive insights.
In addition to overall accuracy, we assessed model robustness under different macroeconomic conditions. Table 2 presents comparative results during the COVID-impacted fiscal year 2020. The GNN retained high discrimination power with an AUC of 0.903, while traditional models showed notable degradation, particularly the logistic model, whose AUC dropped to 0.731. These findings affirm that relational modeling not only boosts average predictive performance but also ensures stability under systemic stress, enabling more reliable early-warning systems for regulators and investors.
|
Model |
AUC |
C-index |
|
Logistic Regression |
0.783 |
0.752 |
|
Random Forest |
0.812 |
0.779 |
|
LSTM |
0.85 |
0.816 |
|
GNN (Ours) |
0.921 |
0.887 |
|
Model |
AUC |
C-index |
|
Logistic Regression |
0.731 |
0.701 |
|
Random Forest |
0.778 |
0.745 |
|
LSTM |
0.821 |
0.788 |
|
GNN (Ours) |
0.903 |
0.864 |
5.2. Ablation and sensitivity analysis
Ablation results showed that supply-chain links had the largest influence on model performance, followed by ownership ties and then shared directors. This ranking aligns with intuitive contagion channels: operational dependencies spread risk faster than governance overlaps. Sensitivity analysis revealed that the model’s performance was stable within one standard deviation of optimal hyperparameter settings, confirming robustness. Changes in dropout rates or layer depth had minor effects unless pushed to extremes. These findings suggest that while tuning is important, the GNN’s architecture inherently captures meaningful signal from the graph. The model’s resilience to small perturbations enhances its practical reliability in deployment.
5.3. Case study of high-risk firms
To illustrate the model’s interpretability and practical value, we examined a defaulted electronics supplier flagged as high-risk 18 months before bankruptcy. Visualization of message-passing attention revealed concentrated influence from several distressed upstream partners. These relationships were not captured in traditional financial metrics, yet they significantly elevated the firm’s predicted hazard rate. The GNN architecture allowed us to trace how signals propagated through multiple network hops. This transparency enables risk managers to understand not just the “what” but the “why” behind predictions. Case-level analysis demonstrates that the model can serve as both a prediction tool and a decision-support system.
6. Conclusion
This study demonstrates that incorporating inter-firm relational data through graph neural networks significantly enhances the accuracy and robustness of corporate default prediction. The GNN-based approach captures both firm-specific financial signals and systemic exposures embedded in supply-chain and ownership networks. Empirical evaluations confirm its superiority over traditional models, particularly under macroeconomic stress. By visualizing risk propagation paths, the framework also improves interpretability. These findings advocate for broader adoption of network-aware risk models in credit analytics and financial regulation. Future research may explore dynamic graph extensions and cross-border firm linkages.