


1 Introduction
ECG (Electrocardiogram) signals are critical for diagnosing and monitoring heart activity [1]. These signals reflect the heart's electrical activity in real-time, providing vital insights into conditions such as arrhythmias, myocardial infarction, and other cardiac issues. Their ability to non-invasively assess heart function makes them essential in both routine check-ups and emergency settings. However, manually analyzing ECG data can be time-consuming and error-prone due to the complexity of the signal patterns. This has driven the development of automated systems using AI and deep learning, which have demonstrated improved accuracy and efficiency in interpreting ECG signals, significantly enhancing the early detection of heart diseases. With recent advancements in deep learning, automated systems have become increasingly effective in supporting clinicians by accurately classifying ECG signals [2]. These systems help reduce the manual workload and improve diagnostic precision, particularly for detecting conditions like arrhythmias and heart failure. The combination of CNNs and GRUs offers a powerful approach to capturing both spatial and temporal patterns in ECG data, enabling more accurate classification of heart conditions [3]. This study focuses on developing a CNN-GRU model that is simple yet robust, aimed at improving the early detection of various heart abnormalities, providing vital support in clinical decision-making
2 Heartbeat classification and research objectives based on the ECG5000 dataset
2.1 Introduction to the ECG5000 dataset
The ECG5000 dataset is part of the University of California Riverside (UCR) Time Series Classification Archive, a widely recognized collection of time-series datasets used extensively for machine learning research. The archive hosts a diverse range of datasets, making it a crucial resource for exploring various types of sequential data, including those related to biological signals. In particular, the ECG5000 dataset contains data from electrocardiogram (ECG) readings, which capture the electrical activity of the heart. ECG signals are often used to monitor heart health and diagnose cardiovascular conditions, providing a valuable source of information for medical research and clinical decision-making [4]. This dataset serves as an essential tool for machine learning models, enabling the study of heart conditions through the analysis of time-series data.
2.2 Description of heartbeat categories in the ECG5000 dataset
The ECG5000 dataset categorizes heartbeats into five distinct classes, each representing a specific type of cardiac activity. These categories are instrumental in diagnosing various heart conditions, as they reflect different patterns of heart activity:
Normal Heartbeat: This class represents regular and healthy heart activity, where the electrical impulses in the heart function normally, resulting in a steady and rhythmic heartbeat.
R-on-T Premature Ventricular Contraction (PVC): In this condition, a ventricular contraction occurs prematurely, interrupting the heart's normal repolarization phase. This irregularity can potentially lead to arrhythmias, as the heart’s electrical system is disrupted before the next heartbeat.
Premature Ventricular Contraction (PVC): A more common type of abnormal heartbeat, PVCs occur when the ventricles contract earlier than usual, which can be felt as an irregular or skipped beat. While PVCs are often benign, they can indicate underlying heart issues in some cases.
Supraventricular Premature Beat: This type of abnormal beat originates in the heart's upper chambers (the atria). It is characterized by an early electrical impulse that causes a premature contraction, differing from normal sinus rhythm [5].
Unclassified Beat: This category includes heartbeats that do not fit neatly into the other classifications. These irregular beats may require further medical investigation to determine their cause and significance.
2.3 Research goals and significance of the ECG5000 dataset
The ECG5000 dataset plays a critical role in advancing research aimed at diagnosing and understanding heart conditions. By categorizing heartbeats into five distinct classes, it enables researchers to develop and train machine learning models that can automatically detect and classify different types of heart rhythms. This not only enhances the accuracy of diagnosing conditions such as arrhythmias but also supports the development of early warning systems for patients with cardiovascular risks. The ability to analyze and predict abnormal heart activity through such datasets can significantly contribute to the field of cardiology, providing insights that may lead to improved patient outcomes and more effective treatments.
3 Model structure
In this study, we designed a hybrid model that integrates Convolutional Neural Networks (CNN) with Gated Recurrent Units (GRU) to effectively process and classify ECG signals. This combination leverages the strengths of both CNNs in feature extraction and GRUs in capturing temporal dependencies, which are crucial for understanding the sequential nature of heartbeats.
3.1 CNN layers: Feature extraction
The CNN layers serve as the initial component of the model, designed to extract important local patterns from the ECG signals. These patterns include key elements like the P-wave, QRS complex, and T-wave, which are fundamental for diagnosing different heart conditions. By applying convolutional operations across the 140 time steps of the input signal, the CNN is able to identify relevant features, which are then passed on for further processing.
3.2 GRU layers: Temporal dependencies
After the feature extraction by CNNs, the GRU layers handle the sequential nature of the ECG data. The ECG signal is inherently temporal, with each beat influencing subsequent beats. The GRU component of the model helps in learning how the extracted patterns evolve over time, allowing the model to capture complex interactions that occur in the signal and enabling it to differentiate between various heart conditions based on these temporal dynamics [6].
3.3 Squeeze-and-Excitation (SE) blocks
To further enhance the model's performance, we incorporated Squeeze-and-Excitation (SE) blocks. These blocks are designed to adaptively recalibrate the features extracted by the CNN layers, focusing the model’s attention on the most informative parts of the ECG signals. By emphasizing the most relevant aspects of the input data, SE blocks help improve classification accuracy, making the model more effective at distinguishing between different heart conditions.
3.4 Model overview
The model is structured to process ECG signals with 140 time steps and outputs one of five categories of heart conditions. These conditions include normal heartbeat, R-on-T premature ventricular contraction, premature ventricular contraction, supraventricular premature beat, and unclassified beats.
A detailed layer-by-layer breakdown of the model architecture is shown in Table 1. This table outlines the key components of the model, including their layer types, output shapes, parameter counts, and how each layer is connected within the overall architecture [7]. The table highlights the intricate combination of convolutional and recurrent layers along with other key components like global average pooling and SE blocks, demonstrating the model's capability to process and classify ECG data efficiently.
Table 1. Layer Model
Layer (type) |
Output Shape |
Param # |
Connected to |
input_1 (InputLayer) |
(None, 140, 1) |
0 |
[] |
conv1d (Conv1D) |
(None, 47, 128) |
6528 |
['input_1[0][0]'] |
batch_normalization (BatchNormalization) |
(None, 47, 128) |
512 |
['conv1d[0][0]'] |
max_pooling1d (MaxPooling1D) |
(None, 16, 128) |
0 |
['batch_normalization[0][0]'] |
conv1d_1 (Conv1D) |
(None, 16, 32) |
28704 |
['max_pooling1d[0][0]'] |
batch_normalization_1 (BatchNormalization) |
(None, 16, 32) |
128 |
['conv1d_1[0][0]'] |
max_pooling1d_1 (MaxPooling1D) |
(None, 8, 32) |
0 |
['batch_normalization_1[0][0]'] |
global_average_pooling1d (GlobalAveragePooling1D) |
(None, 32) |
0 |
['max_pooling1d_1[0][0]'] |
dense (Dense) |
(None, 4) |
128 |
['global_average_pooling1d[0][0]'] |
dense_1 (Dense) |
(None, 32) |
128 |
['dense[0][0]'] |
multiply (Multiply) |
(None, 8, 32) |
0 |
['max_pooling1d_1[0][0]', 'dense_1[0][0]'] |
conv1d_2 (Conv1D) |
(None, 8, 32) |
10272 |
['multiply[0][0]'] |
conv1d_3 (Conv1D) |
(None, 4, 128) |
20608 |
['conv1d_2[0][0]'] |
max_pooling1d_2 (MaxPooling1D) |
(None, 2, 128) |
0 |
['conv1d_3[0][0]'] |
conv1d_4 (Conv1D) |
(None, 2, 512) |
328192 |
['max_pooling1d_2[0][0]'] |
global_average_pooling1d_1 (GlobalAveragePooling1D) |
(None, 512) |
0 |
['conv1d_4[0][0]'] |
dense_2 (Dense) |
(None, 32) |
16384 |
['global_average_pooling1d_1[0][0]'] |
dense_3 (Dense) |
(None, 512) |
16384 |
['dense_2[0][0]'] |
multiply_1 (Multiply) |
(None, 2, 512) |
0 |
['conv1d_4[0][0]', 'dense_3[0][0]'] |
add (Add) |
(None, 2, 512) |
0 |
['conv1d_4[0][0]', 'multiply_1[0][0]'] |
gru (GRU) |
(None, 128) |
246528 |
['add[0][0]'] |
dropout (Dropout) |
(None, 128) |
0 |
['gru[0][0]'] |
dense_4 (Dense) |
(None, 512) |
66048 |
['dropout[0][0]'] |
dropout_1 (Dropout) |
(None, 512) |
0 |
['dense_4[0][0]'] |
dense_5 (Dense) |
(None, 5) |
2565 |
['dropout_1[0][0]'] |
4 Training and testing the model
4.1 Data augmentation
To enhance the performance of the model and prevent overfitting, we applied several data augmentation techniques to the ECG signals. This process involves creating modified versions of the original data, which helps the model generalize better and become more robust. Specifically, we employed the following methods:
Time Scaling: This technique involves speeding up or slowing down the ECG signals to simulate different heart rates. By varying the speed of the heartbeats, the model is exposed to a wider range of possible ECG patterns, making it more adaptable to real-world scenarios [8].
Time Shifting: Time shifting involves moving the ECG signals forward or backward along the time axis. This introduces variation in the timing of key patterns, such as the P-wave and QRS complex, and helps the model better understand the temporal dynamics of heartbeats.
Adding Noise: To simulate real-world noise and imperfections in ECG recordings, we introduced slight random noise to the signals. This noise makes the model more resilient to signal distortions that can occur in real-life monitoring systems, enhancing its robustness [9].
These data augmentation strategies ensured that the model was trained on a more diverse set of ECG signals, improving its ability to classify heartbeats accurately across different conditions.
4.2 Training process
The model was trained using the ECG5000 dataset, with the data split into training and validation sets to monitor the model's performance over time. Specifically, 80% of the dataset was allocated for training, while the remaining 20% was reserved as a validation set. This setup allowed us to gauge how well the model generalized to unseen data during training.
For optimization, we used the Adam optimizer, a popular choice for deep learning models due to its ability to adjust learning rates dynamically. The model was trained over 20 epochs with a batch size of 32. During each epoch, the model updated its weights based on the training data and was evaluated on the validation set to ensure it was learning effectively.
Figure 1 below illustrates the Training and Validation Loss curves over the training period. The dashed blue line represents the training loss, while the solid orange line shows the validation loss. Initially, the validation loss increases sharply during the early epochs before stabilizing as the model adjusts to the data. The training loss, on the other hand, decreases steadily, indicating that the model is learning from the data. However, there is some fluctuation in the validation loss after a certain point, suggesting that further fine-tuning or additional data augmentation could potentially improve generalization [9].
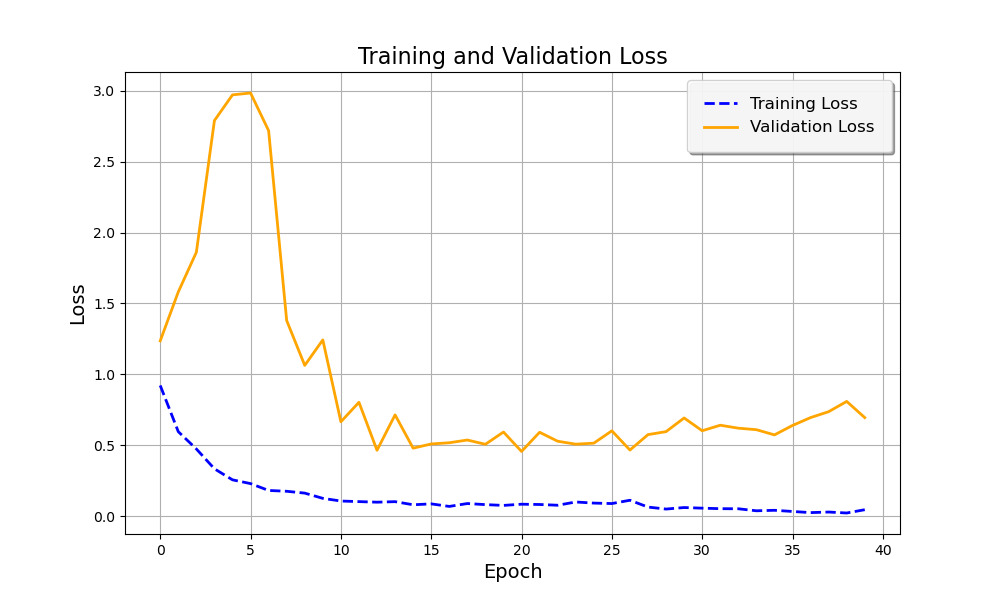
Figure 1. Training and Validation Loss
4.3 Test results
After completing the training phase, the model was evaluated on a separate test set to assess its final performance. The test set was completely independent of the training and validation data, ensuring an unbiased evaluation of the model's generalization ability. The model achieved an impressive test accuracy of 94.19%, demonstrating its effectiveness at distinguishing between the five different types of heartbeats present in the ECG5000 dataset. This high level of accuracy indicates that the hybrid CNN-GRU model, combined with data augmentation techniques, was able to successfully learn the key features of ECG signals and classify heart conditions with a high degree of reliability.
5 Conclusion
In this study, we successfully developed a CNN-GRU hybrid model capable of classifying ECG signals into five distinct categories, providing a tool for detecting both normal and abnormal heart activity. By leveraging CNN layers for effective feature extraction and GRU layers for capturing the sequential nature of heartbeats, the model demonstrated strong performance on the ECG5000 dataset, achieving a high test accuracy of 94.19%. Data augmentation techniques, such as time scaling, time shifting, and adding noise, were employed to enhance the model's robustness and generalization capabilities. The use of Squeeze-and-Excitation (SE) blocks further improved the model’s ability to focus on the most informative parts of the signals [10]. This model showcases the potential of combining CNNs and GRUs for automated ECG analysis, which could assist healthcare professionals in diagnosing heart conditions more efficiently and accurately. With further refinement, this model could serve as a valuable tool in clinical settings, improving diagnostic precision and patient outcomes.